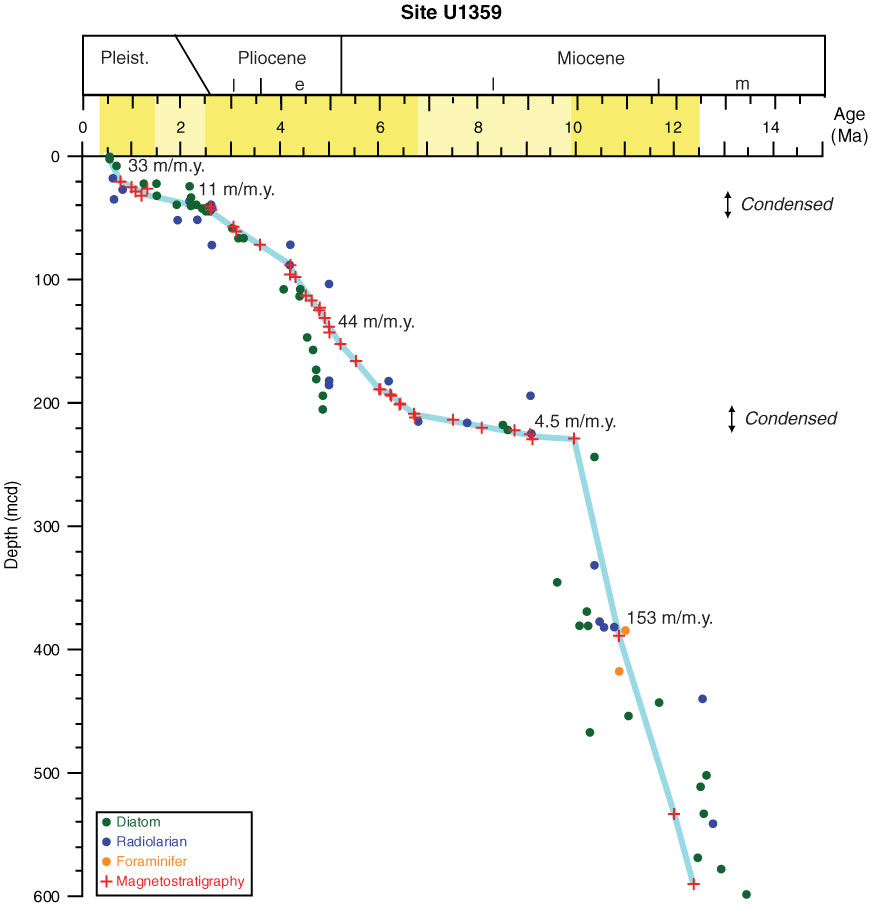
Figure F28. Biomagnetostratigraphic age-depth plot, Site U1359. Yellow shading = chronostratigraphic preservation, light yellow shading = low sedimentation rates. Microfossil datums are plotted by using the median depth between upper and lower samples (Table T11). Mid-point absolute age in the average range model of Cody et al. (2008) is used for the diatom datums. t = top, b = bottom, o = oldest, y = youngest. Blue line = best-fit sedimentation rate.
Previous | Close | Next | Top of page