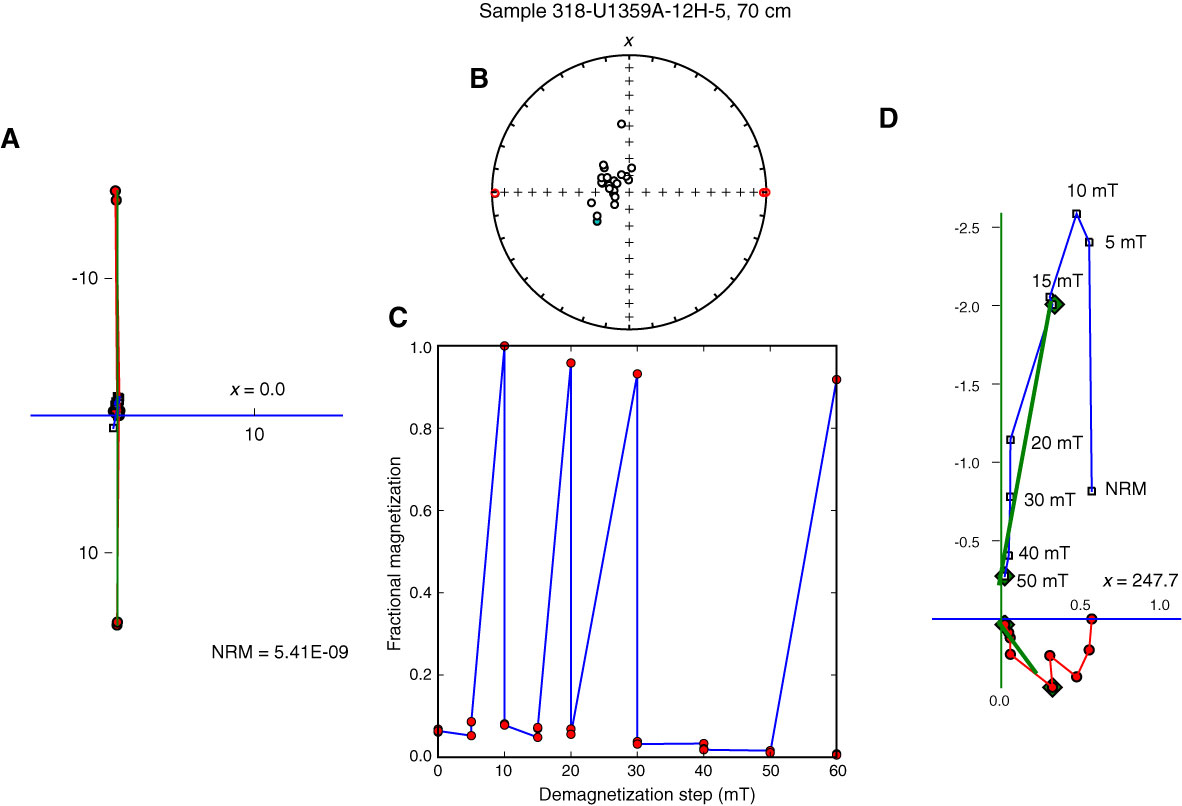
Figure F29. Diagrams of behavior of discrete samples during step-wise alternating-field demagnetization. For each sample, the (A, E, I, M) left diagrams are vector endpoint diagrams before deletion of flux jumps or averaging the three measurements at each step. The (B, F, J, N) equal area projections are the directional data at each demagnetization step. Note the points along the x-, y- and z-axes; these are flux jumps (see text). The (C, G, K, O) intensity decay curves plot the remanent strength after demagnetization at each step. Note the large spikes in C and G, indicating flux jumps. The right diagrams are (D, H, L, P) vector endpoint diagrams after deletion of flux jumps and averaging multiple measurements at each step. Green lines = best-fit lines. NRM = natural remanent magnetization. A–D. Sample 318-U1359A-12H-5, 70 cm. (Continued on next three pages.)
Previous | Close | Next | Top of page