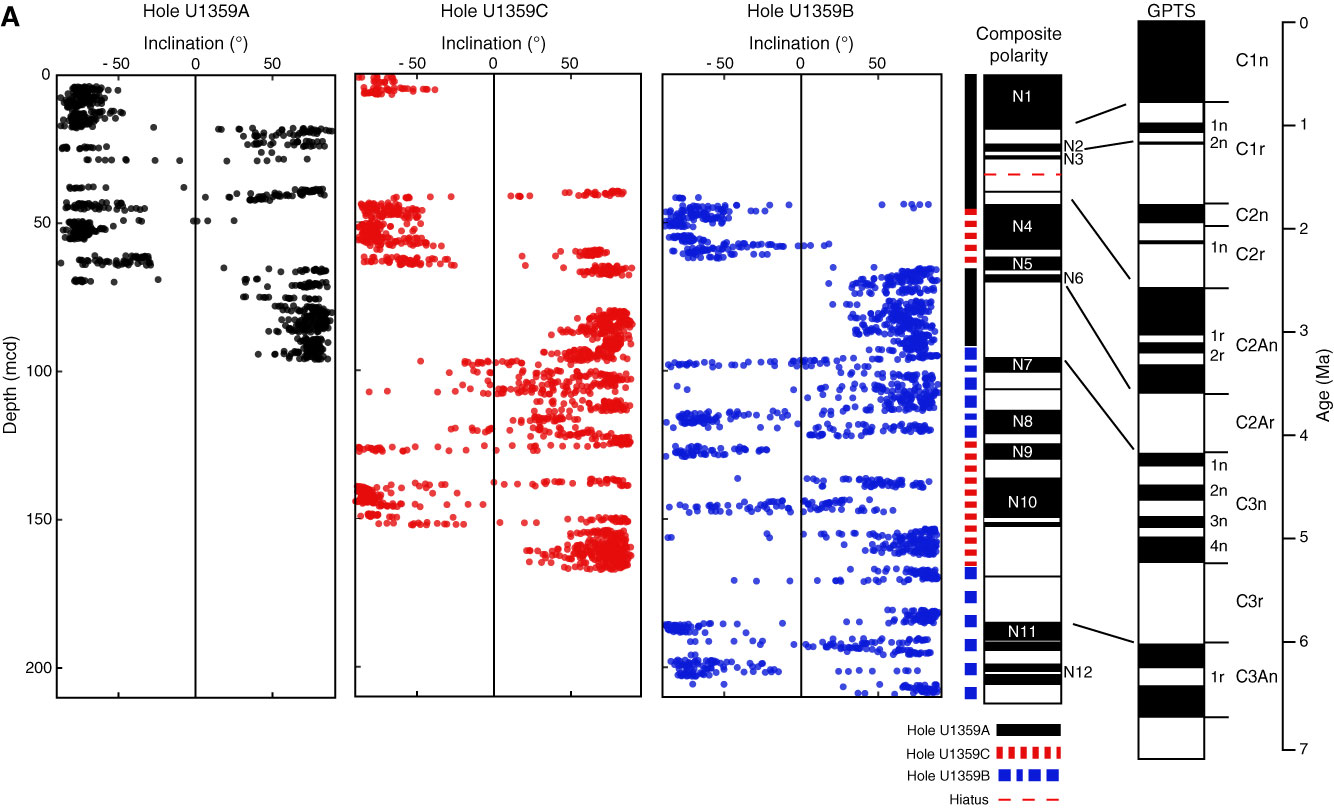
Figure F8. Plots of correlation of magnetostratigraphy to the geomagnetic polarity time scale (GPTS) of Gradstein et al. (2004). Tie-point lines between polarity logs and GPTS are listed in Table T12. Purple shaded areas = gaps in recovery. A. Holes U1359A–U1359C placed on the composite depth scale (see “Stratigraphic correlation and composite section”). The composite polarity log is constructed from the best records from each of the three holes. (Continued on next two pages.)
Previous | Close | Next | Top of page