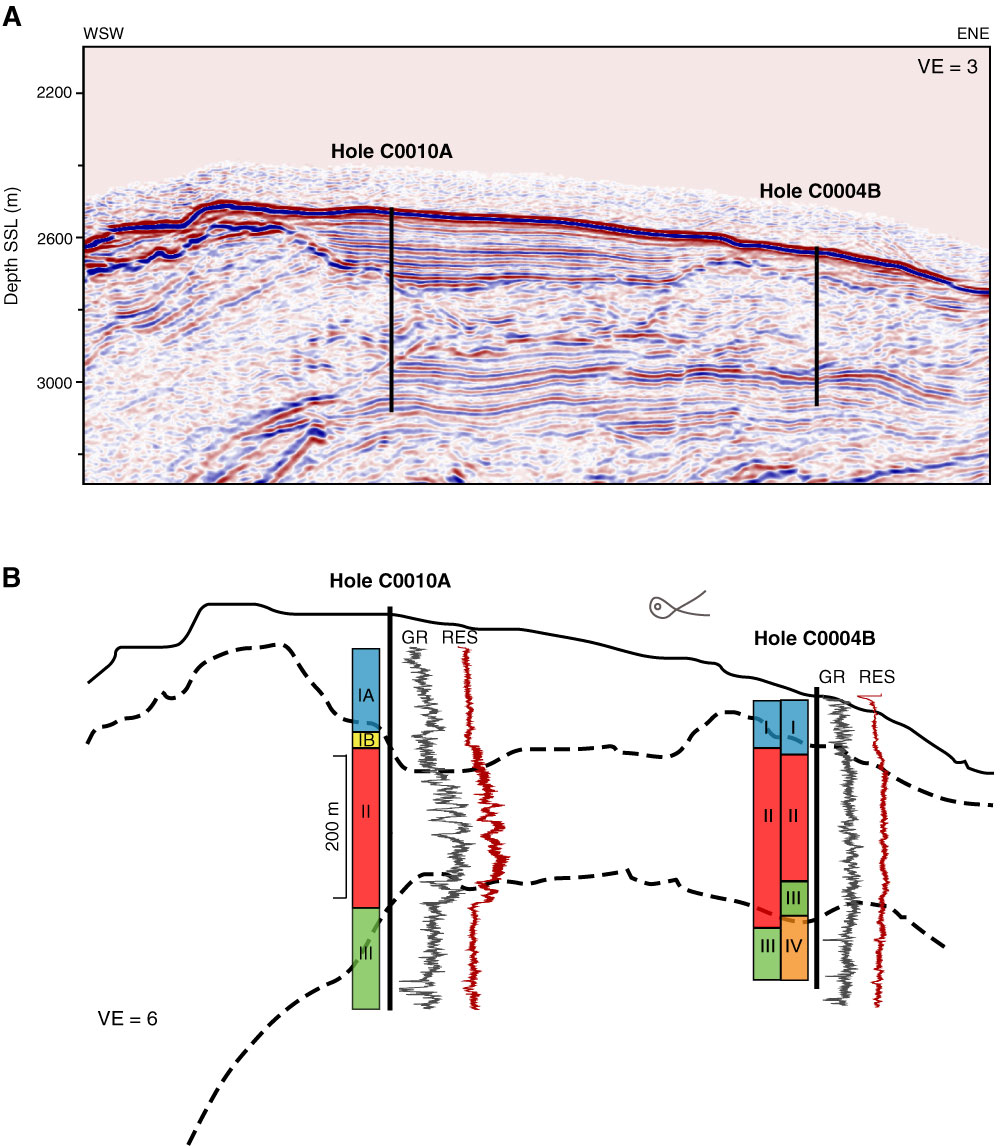
Figure F11. A. Seismic section between Sites C0004 and C0010. B. Basic interpretation of seismic line. Solid line = seafloor, dashed lines = top and base of the thrust wedge, vertical black lines = borehole locations, gray lines = gamma ray (GR) logs, red lines = resistivity (RES) logs. For Site C0010, logging units are shown; for Site C0004, both logging units (left) and lithologic units defined by coring (right) are shown. Note that the vertical exaggeration (VE) is greater in the interpretative diagram.
Previous | Close | Next | Top of page