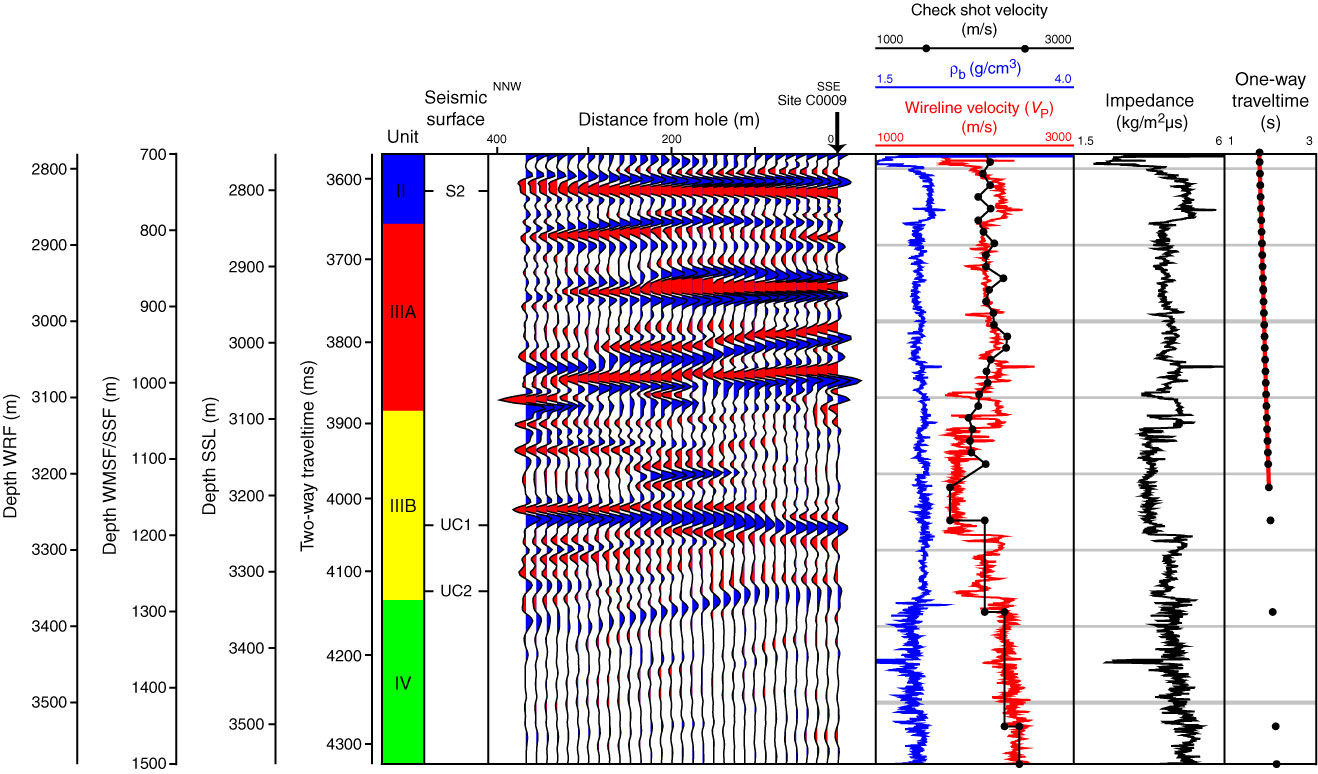
Figure F112. Seismic data correlated to well data from 700 m WMSF to TD, Hole C0009A. Vertical arrow = Site C0009 location on seismic data. Two velocities are plotted to the right of the seismic data. Check shot velocity was used for time-depth correlation; this combines interval velocity taken from check shot with average velocity taken from wireline sonic velocity (VP). Impedance is the product of compressional velocity (VP) and bulk density (ρb). Far right column shows original check shot time data (red line) and one-way traveltime used in time-depth correlation (black dots) (see C0009_T1.XLS in CCLS in "Supplementary material").
Previous | Close | Next | Top of page