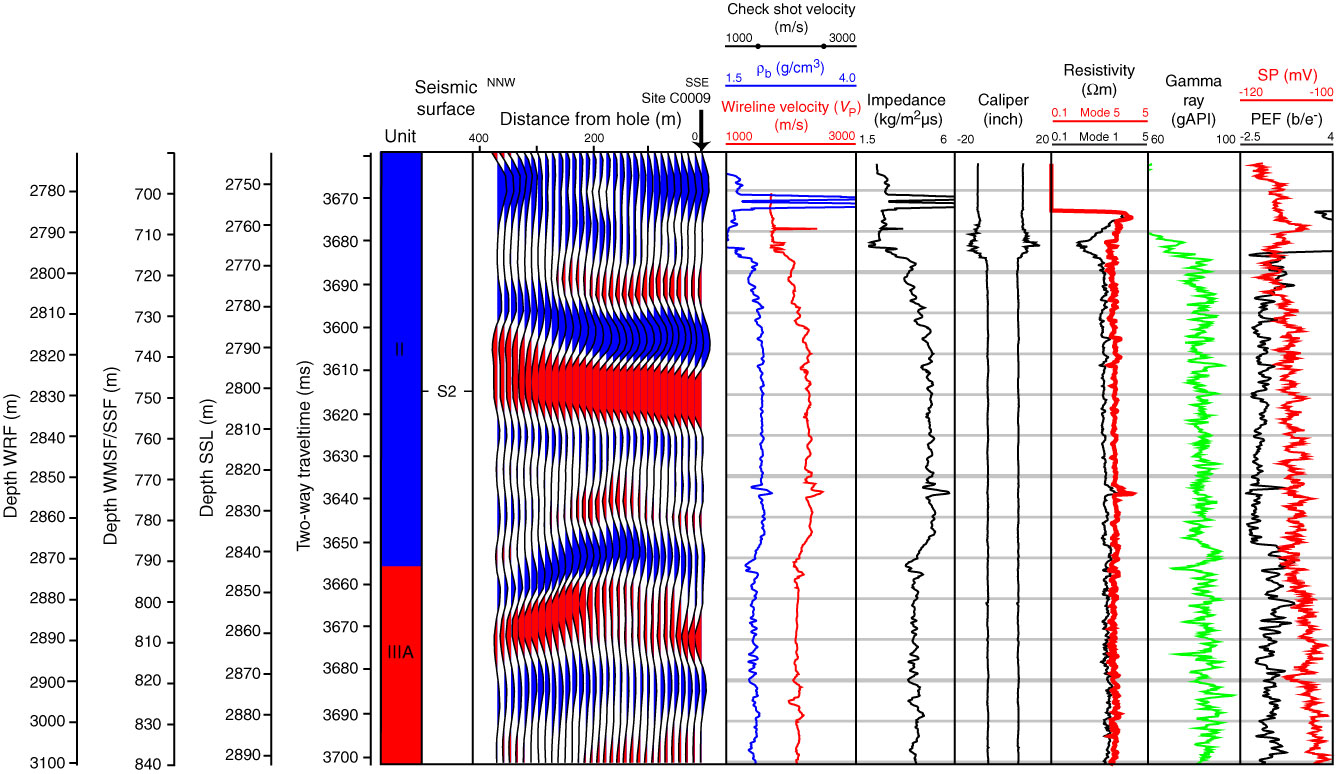
Figure F113. Seismic data correlated to well data from 690 to 840 m WMSF, Site C0009. Vertical arrow = Site C0009 location on seismic data. Two velocities are plotted to the right of the seismic data. Check shot velocity was used for time-depth correlation; this combines interval velocity taken from the check shot with average velocity taken from wireline sonic velocity (VP). Impedance is the product of compressional velocity (VP) and bulk density (ρb). Seismic Surface S2 lies ~40 m above the Unit II/III boundary. SP = spontaneous potential, PEF = photoelectric effect.
Previous | Close | Next | Top of page