Previous | Close | Next
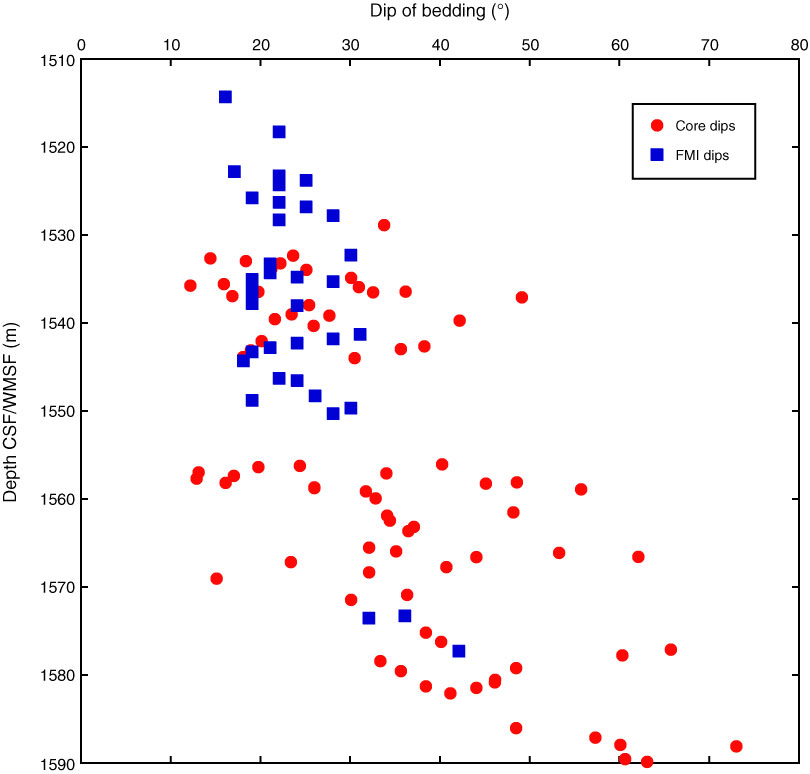
Figure F35. Comparison of bedding dips from cored section and those interpreted from Formation MicroImager (FMI) resistivity log. No dips could be resolved in FMI data from 1560 to 1580 m WMSF.
Previous | Close | Next | Top of page