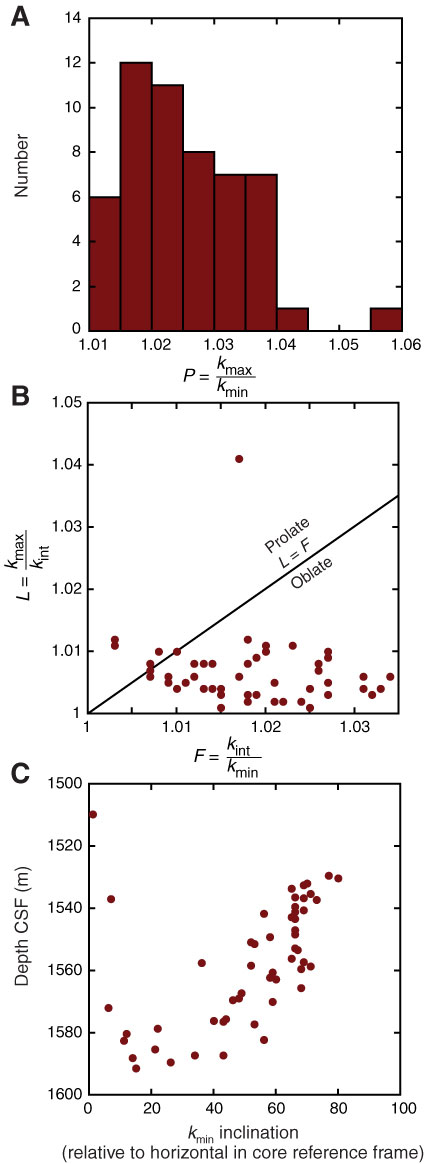
Figure F36. Anisotropy of magnetic susceptibility (AMS) data. A. Occurrences versus ratio of maximum to minimum principal axes of AMS ellipsoid. B. Ratio of maximum to intermediate principal axes of AMS ellipsoid versus ratio of intermediate to minimum principal axes. Plot is similar to a Flinn diagram; therefore, strain in these samples is oblate. C. Inclination of minimum axis versus depth showing values decreasing with depth.

Previous | Close | Next | Top of page