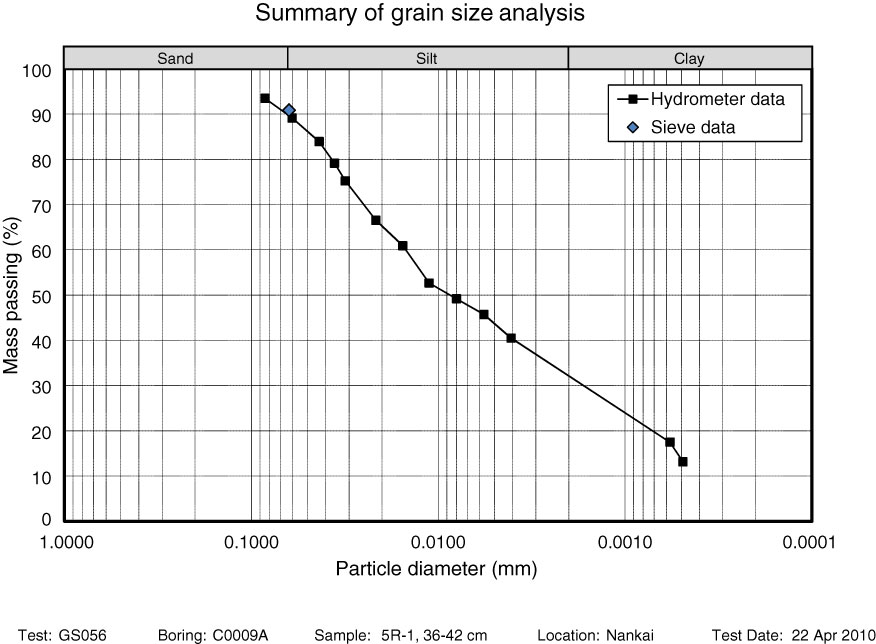
Figure F3. Sample particle size distribution plotted on a semilog scale, Site C0009. Black circles = hydrometer readings, diamond = sand fraction from wet sieving through 63 µm sieve. The sand/silt boundary is defined at 63 µm and the silt/clay boundary is defined at 2 µm. See GRAINSIZ in “Supplementary material” for test results.
Previous | Close | Next | Top of page