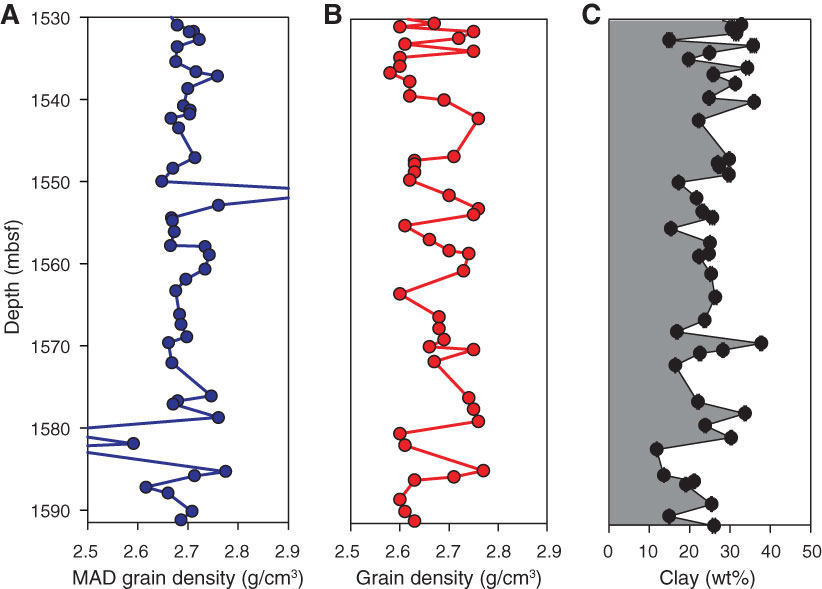
Figure F4. Grain density and clay fraction vs. depth for all measured samples, Site C0009. A. Grain density measured by shipboard scientists (Table T2). B. Grain density used for analyses, determined by averaging two or three MAD grain density measurements. C. Clay fractions determined from hydrometer analyses using grain density shown in B. Gray = clay fraction, white = silt and sand fraction. Positive and negative error bars in clay fraction are determined from using grain density values of 2.6 and 2.8 g/cm3 relative to 2.7 g/cm3 in the clay fraction calculation, respectively.
Previous | Close | Next | Top of page