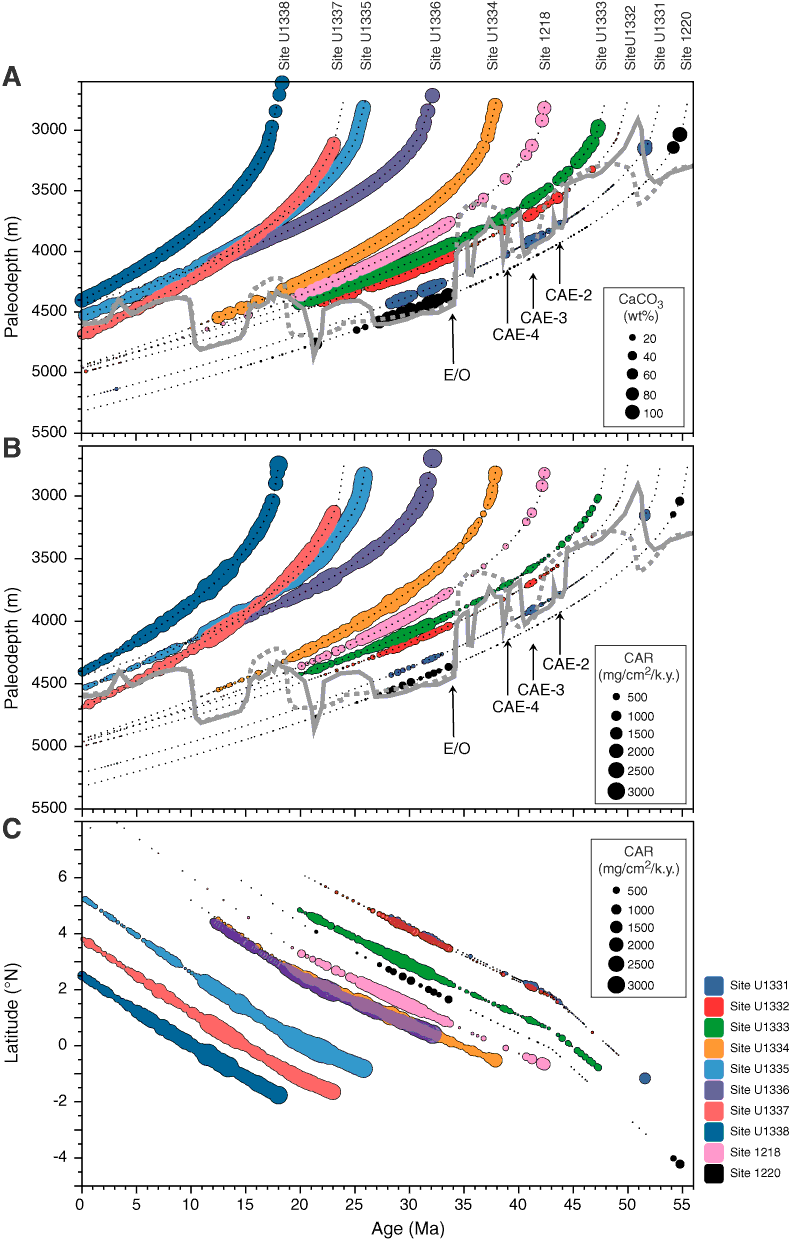
Figure F13. CaCO3 and carbonate mass accumulation rates from Expedition 320/321 and selected ODP Leg 199 sites (1218 and 1220) (Lyle, Wilson, Janecek, et al., 2002). A. Weight percentages from shipboard analysis of samples from all Expedition 320/321 drill sites plotted vs. shipboard PEAT age model for each site and reconstructed paleodepth (see Fig. F3). Bubble area is proportional to CaCO3 wt% measured. Events marked are the Eocene–Oligocene transition (E/O) (e.g., Coxall et al., 2005) and carbonate accumulation events (CAE) of Lyle et al. (2005). Dashed gray line = previous reconstructions of equatorial CCD during the Cenozoic (Lyle, 2003; Rea and Lyle, 2005), solid gray line = revised tentative reconstruction based on new data. B. As in A, with carbonate mass accumulation rates (CAR) for each site. Calculation uses linear sedimentation rates and dry bulk densities determined on board. Sedimentation rates calculated from data tables (see “Stratigraphic correlation and composite section” in each site chapter) adjusted CCSF depth scales by dividing by the growth factor for each site to convert thicknesses back into in situ sediment thickness. C. As in B, plotting carbonate mass accumulation rates (CAR) as a function of age and site paleolatitude, reconstructed using stage poles from Koppers et al. (2001). Note that although the equatorial upwelling zone does result in elevated accumulation rates, the disappearance of carbonate for most sites is primarily a function of paleodepth.

Previous | Close | Next | Top of page