Previous | Close | Next
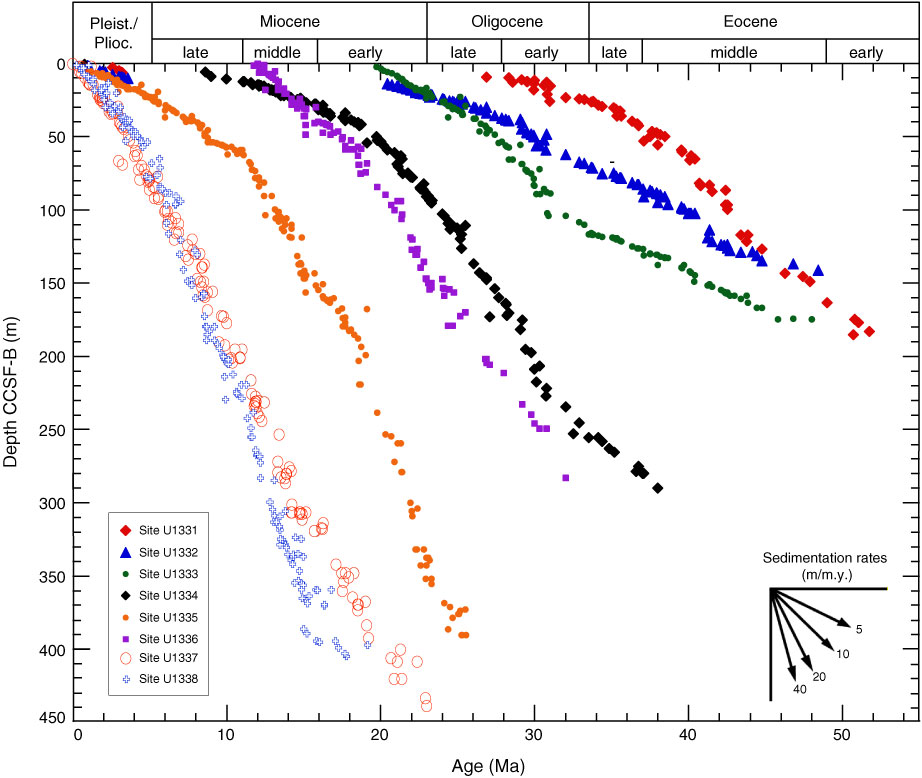
Figure F14. Summary of sedimentation rates derived from age-depth models at each PEAT (Expedition 320/321) site plotted vs. corrected core composite depth.
Previous | Close | Next | Top of page