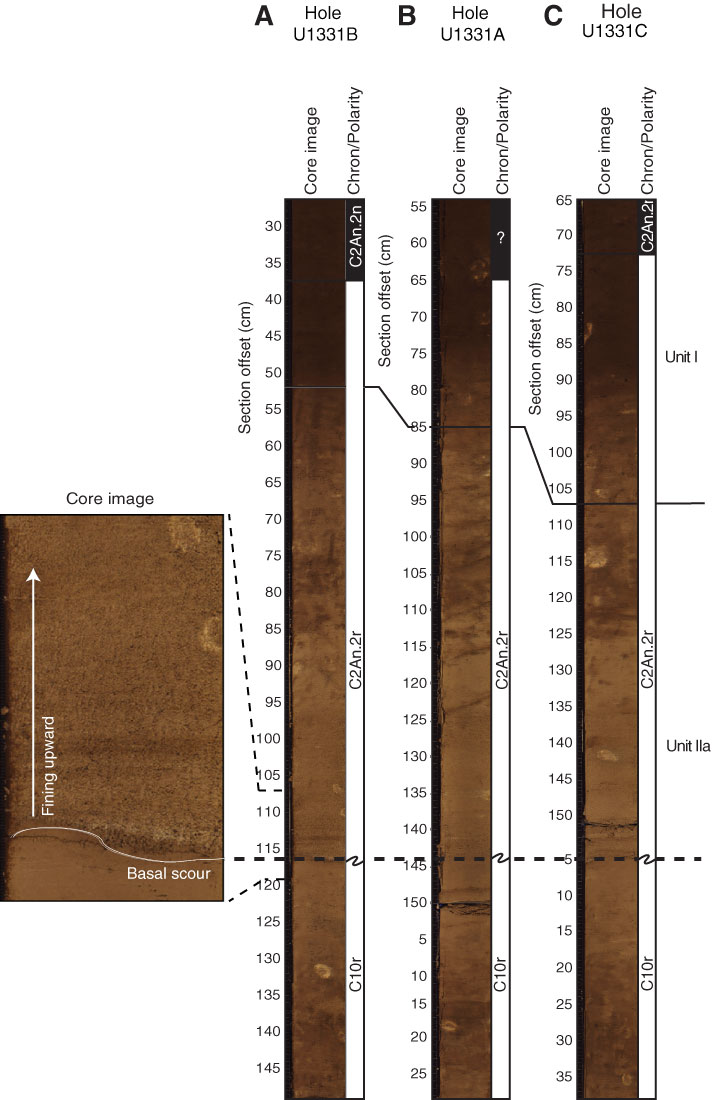
Figure F10. Line scan images of turbidite and probable hiatus located ~0.5 m below the Unit I/Subunit IIa boundary. Magnetostratigraphic interpretation of this interval draws on these lithostratigraphic results (see "Paleomagnetism"). For Chron C2An.2r, correlation to GPTS is uncertain. A. Interval 320-U1331B-1H-5, 26–149 cm. B. Intervals 320-U1331A-2H-1, 54–150 cm, and 2H-2, 0–28 cm. C. Intervals 320-U1331C-1H-5, 65–150 cm, and 1H-6, 0–38 cm. Dashed line indicates basal scour in all holes. Solid line represents Unit I/Subunit IIa boundary.
Previous | Close | Next | Top of page