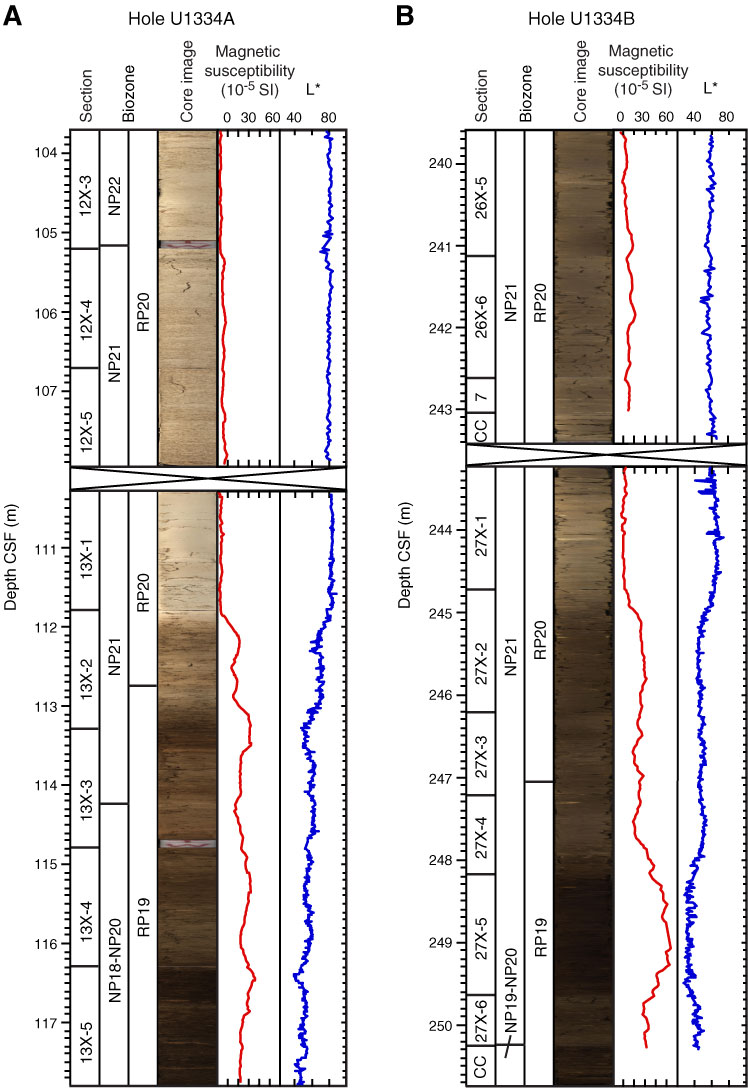
Figure F12. Line scan images of Eocene–Oligocene transition. Images are not adjusted to allow for direct comparison between the two sites. A. Hole U1334A. B. Hole U1334B. L* = reflectance value of sediment as defined in the LAB color model.
Previous | Close | Next | Top of page