Previous | Close | Next
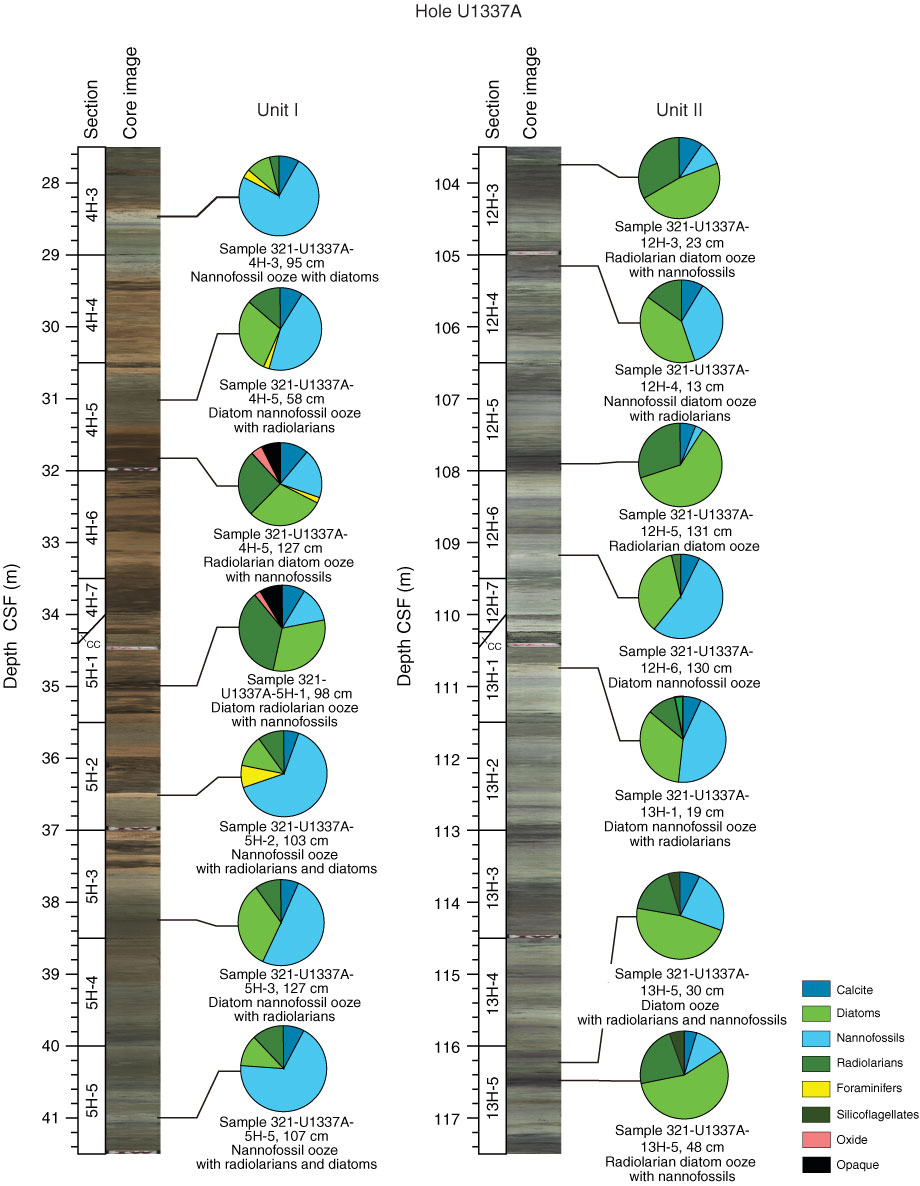
Figure F7. Line scan images and smear slide data from intervals characteristic of Units I and II.
Previous | Close | Next | Top of page