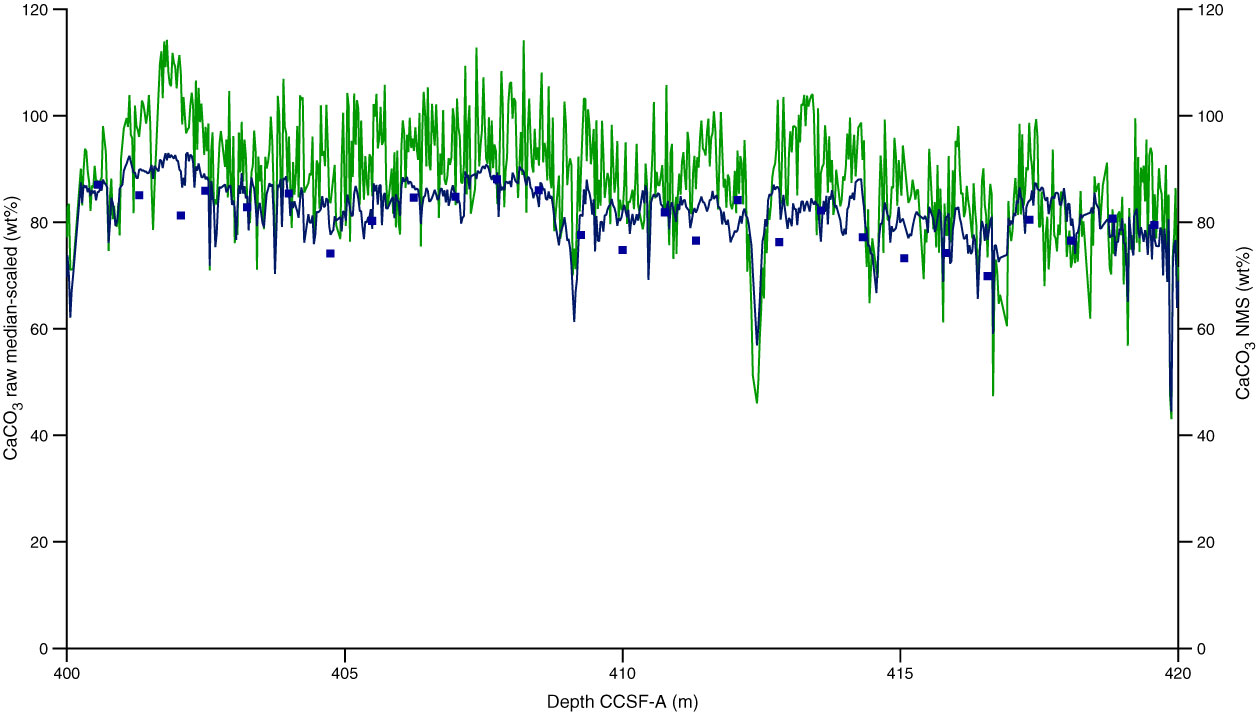
Figure F4. Comparison of raw median-scaled CaCO3 data (green) with normalized (NMS) CaCO3 estimate (blue), and discrete low-resolution CaCO3 (J. Backman, unpubl. data) over the interval 400–420 mcd on the Site U1338 splice, shown in core composite depth below seafloor (CCSF), method A (overlapping). Raw data are significantly more variable because it is more difficult to land the XRF detector perfectly on the cracked and uneven surface of stiffer sediments. Normalizing the sum of components to 100% significantly removes the amount of sample-to-sample variability.
Previous | Close | Next | Top of page