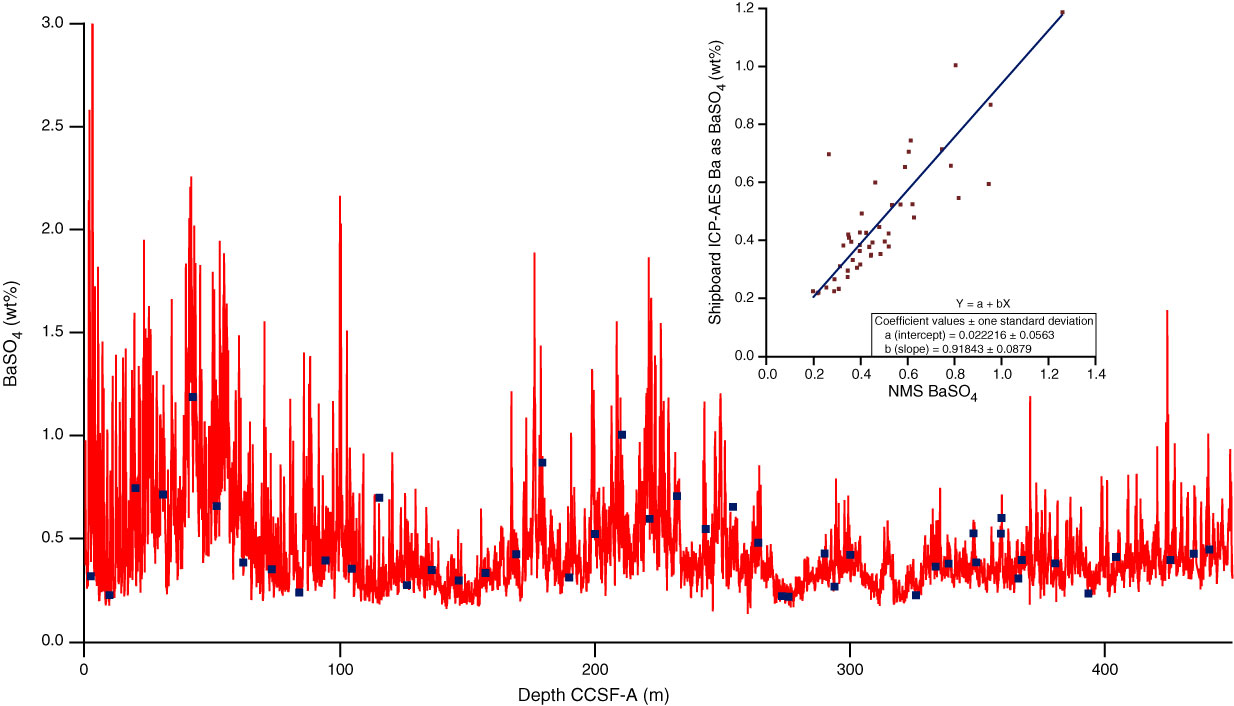
Figure F5. Comparison of the preliminary XRF-estimated BaSO4 (red) to shipboard Ba (blue) measured by inductively coupled plasma–atomic emission spectroscopy (ICP-AES) expressed as BaSO4. Calibration graph is shown on right. Additional samples are needed for the calibration to better sample the range in Ba variability, but the match is encouraging. NMS = normalized.
Previous | Close | Next | Top of page