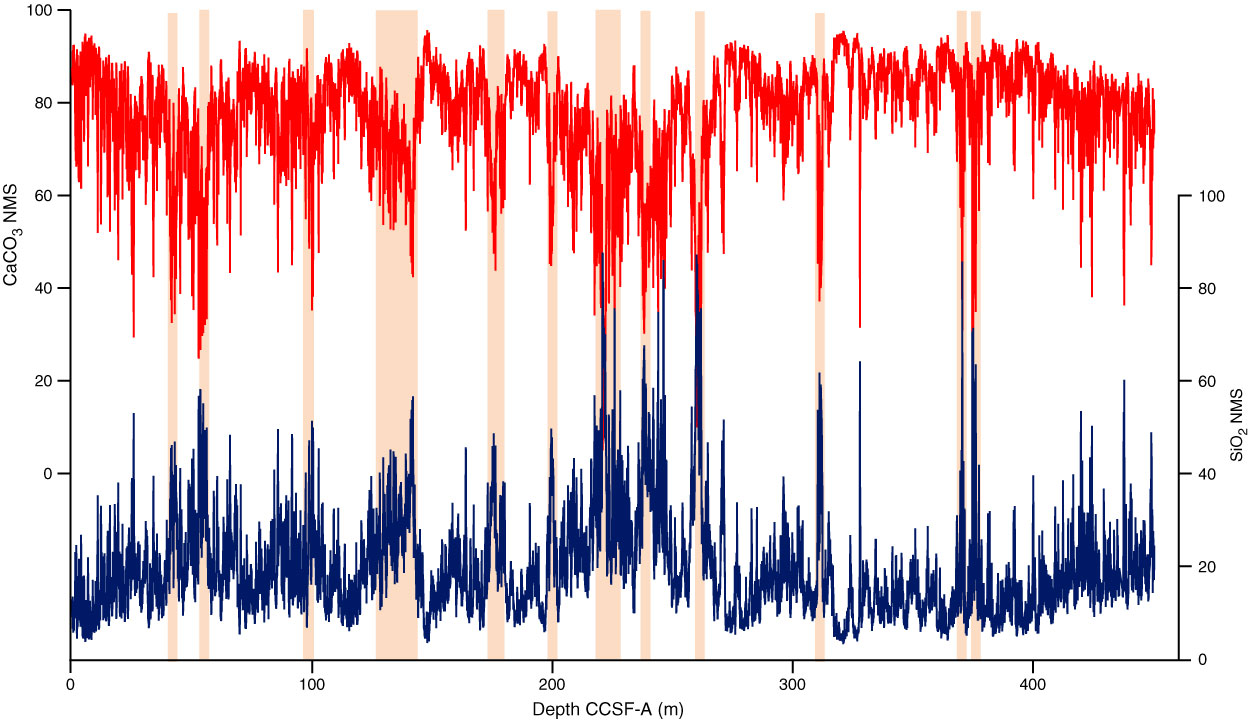
Figure F6. Comparison of uncalibrated normalized (NMS) CaCO3% (red) and SiO2% (blue) along the Site U1338 splice. Tan bands highlight prominent CaCO3 lows/SiO2 highs. Much of the SiO2 at Site U1338 is biogenic, so these represent either high bio-Si production and burial or high CaCO3 dissolution. Higher resolution periodicity is apparent in the records and will be used for tuning sedimentation rates and to understand how the biogenic components respond to orbital forcing.
Previous | Close | Next | Top of page