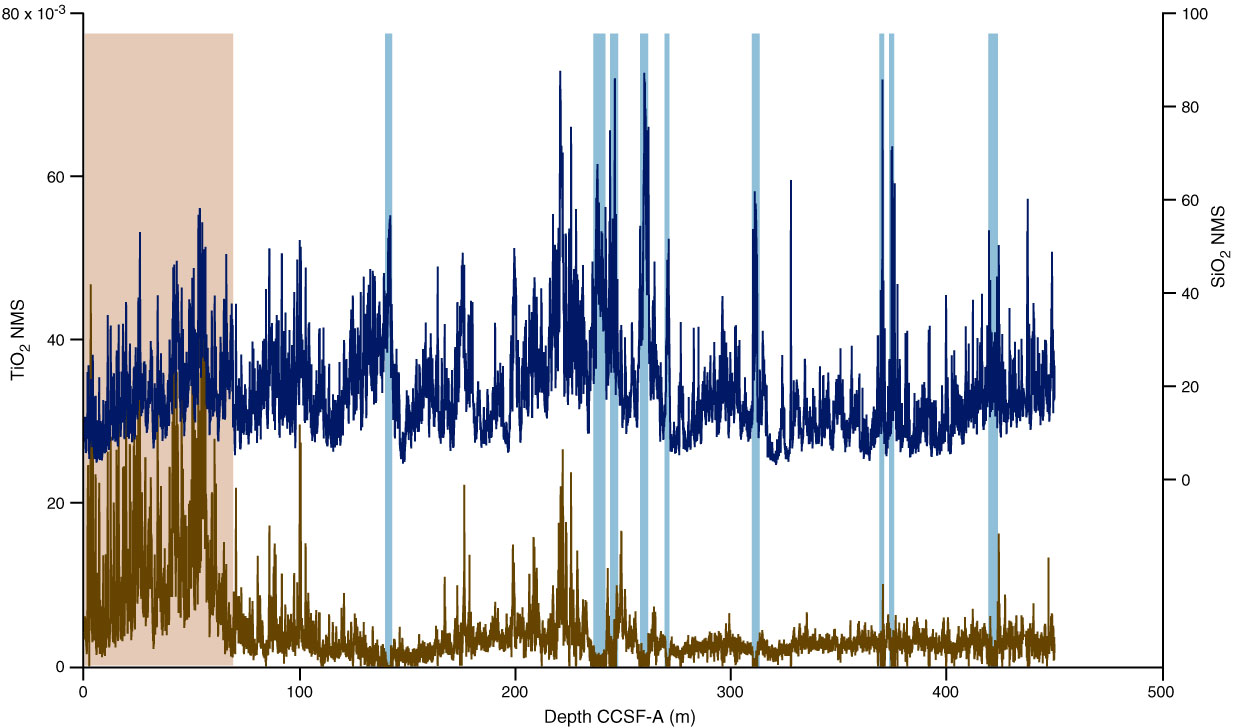
Figure F7. Comparison of uncalibrated normalized (NMS) TiO2% (brown) and SiO2% (blue) to discern clay (aluminosilicate) vs. biogenic contributions to the SiO2 signal. Blue bands mark high biogenic-SiO2, determined when the SiO2 is at a maximum but aluminosilicate elements like TiO2 disappear. The brown band at the top of the sediment section is an area with moderate SiO2 but relatively high amounts of TiO2, representing elevated aluminosilicates compared to the rest of the core. TiO2 probably increases because of additional dissolution of bio-SiO2 as sedimentation rates slow.
Previous | Close | Top of page