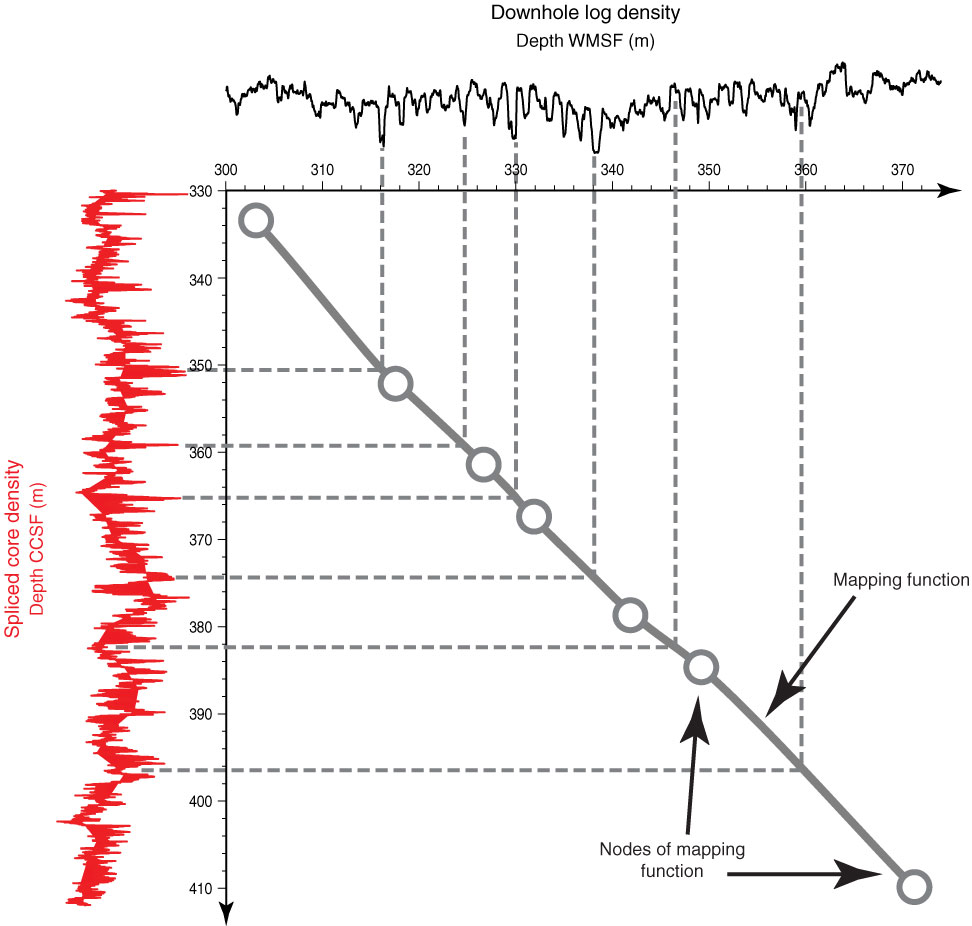
Figure F1. A spliced core density record (red) can be closely correlated to a downhole density log (black); correlations of discrete features are shown by dashed gray lines. The conversion between core depth and log depth is given by a mapping function (thick gray curve) defined by a few nodes (gray dots).
Close | Next | Top of page