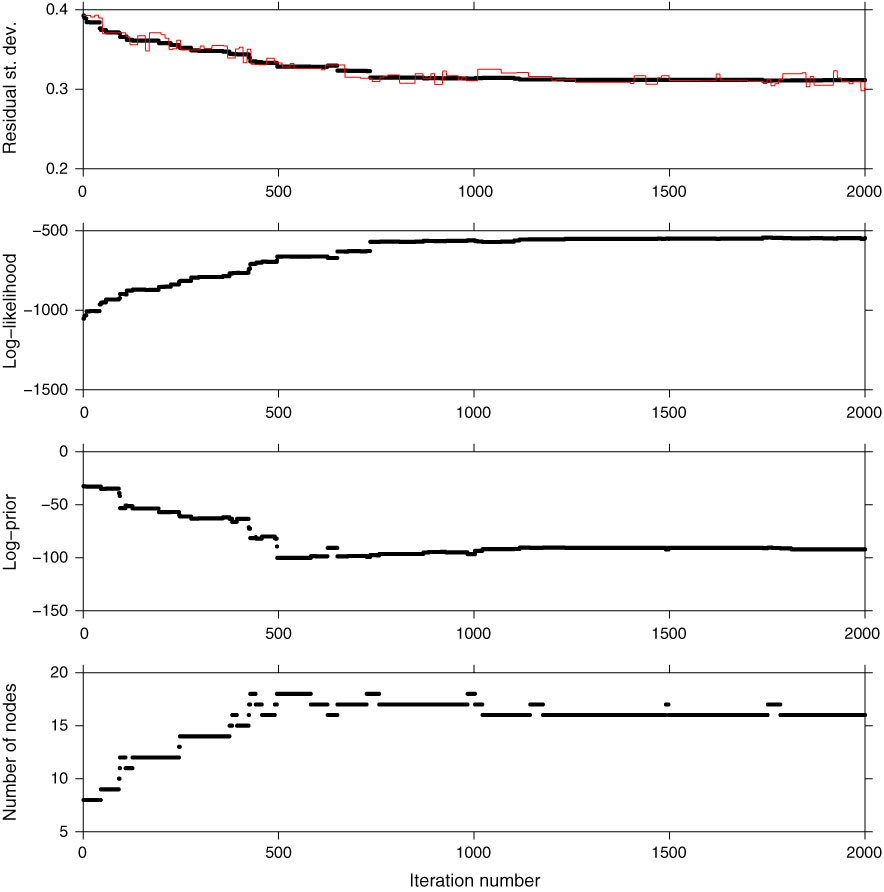
Figure F2. Progress of the reversible jump Monte Carlo algorithm in 2000 iterations. The residual standard deviation, which measures the mismatch between the two records, progressively decreases and the likelihood correspondingly increases. The red line shows the value of the target residual standard deviation, which is one of the unknown parameters and is adjusted by the algorithm during sampling. The value of the prior distribution decreases as the number of nodes necessary to improve the match between the two records increases.
Previous | Close | Next | Top of page