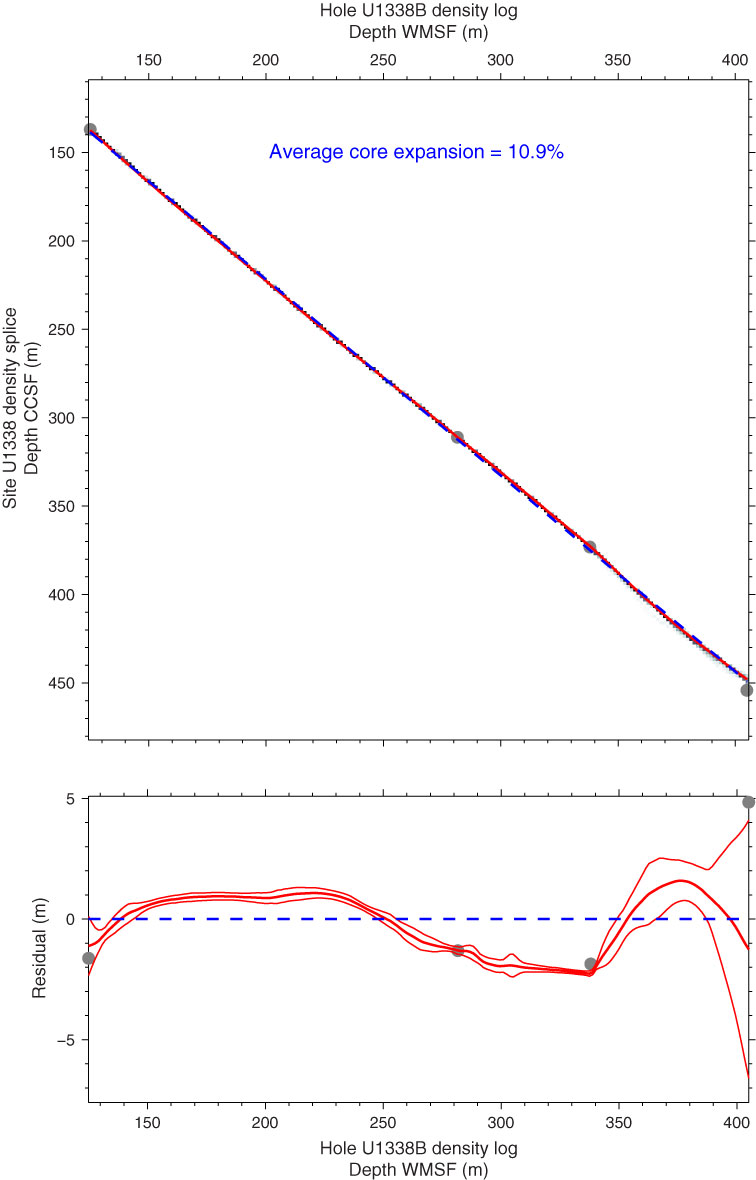
Figure F4. Mapping function between core splice and downhole log data (top) and residual of mapping function over the average core expansion (bottom) at Site U1338. The average mapping function is shown by a thick red line, and uncertainty bounds (±1 standard deviation) by thin red lines. The thick blue dashed line shows the average core expansion, and the gray dots are the starting nodes for the correlation.
Previous | Close | Next | Top of page