Previous | Close | Next
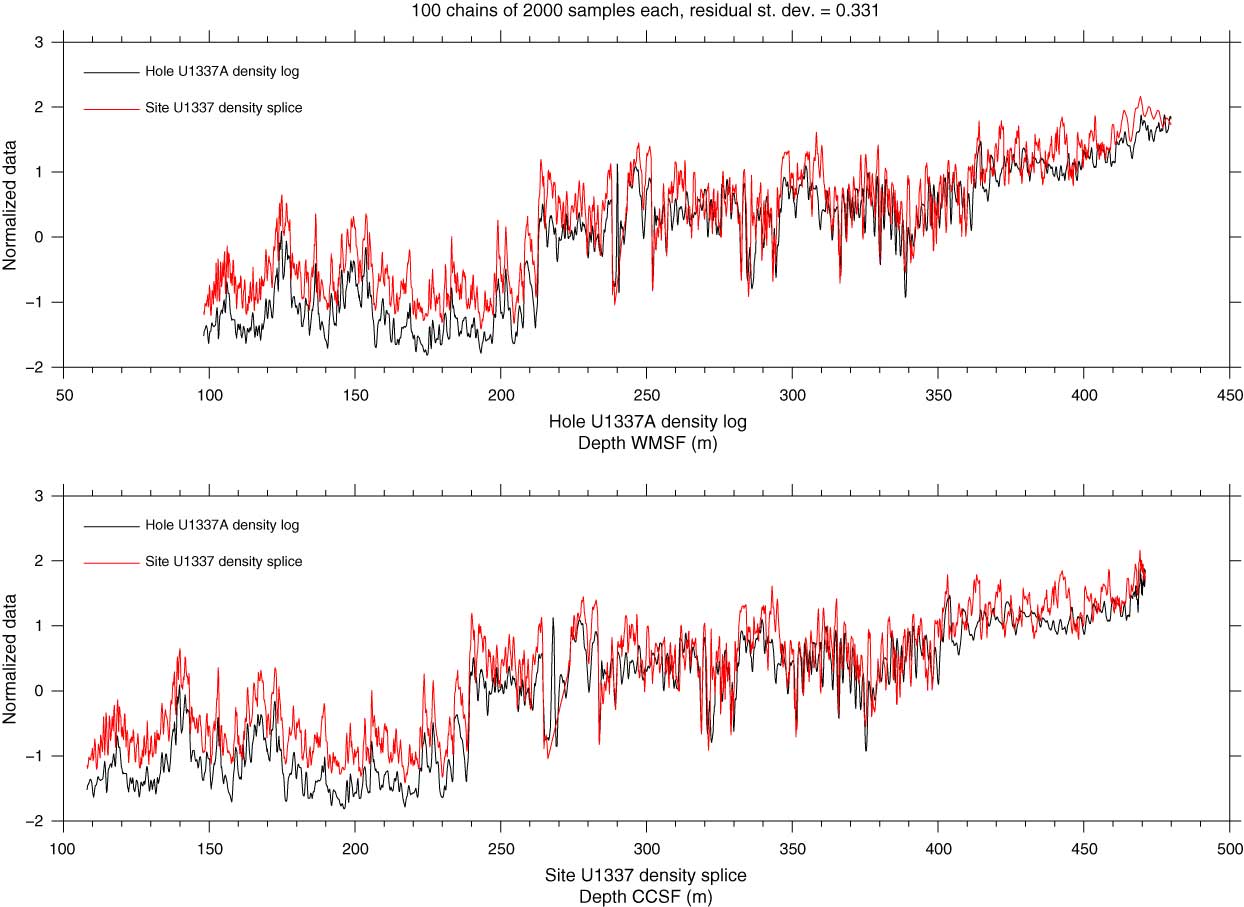
Figure F5. Core splice (red) and downhole log data (black) at Site U1337 plotted on the same depth scale from the mapping function in Figure F3.
Previous | Close | Next | Top of page