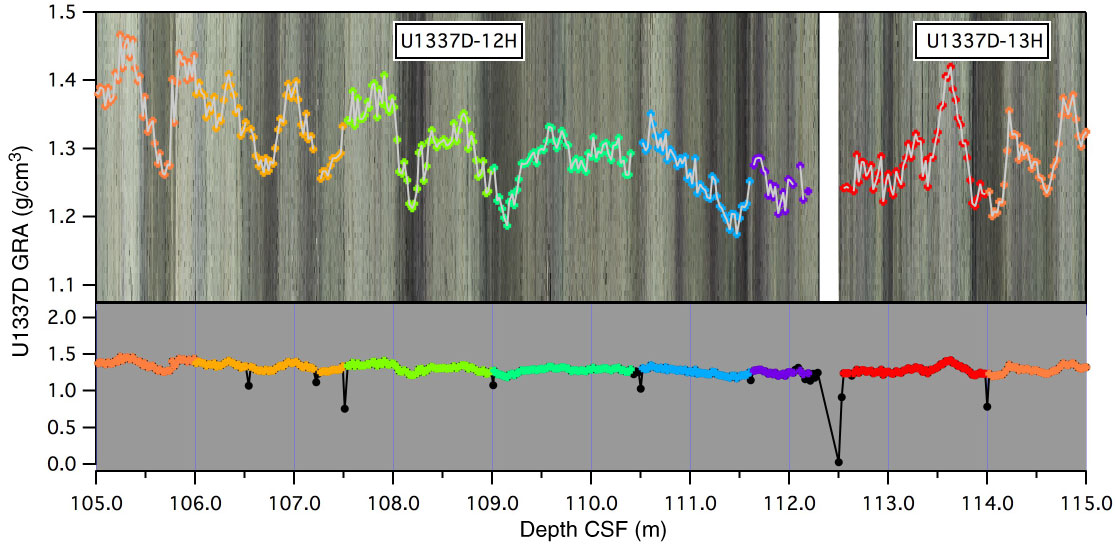
Figure F2. Example from the bottom of Core 321-U1337D-12H and the top of Core 321-U1337-13H illustrating the technique used to clean physical properties data prior to splicing. Data were plotted on top of consolidated core images (top) and against a neutral background (bottom). Sections are represented by different color symbols from Section 1 (red) to Section 7 (purple). Black symbols in the lower plot represent raw data before cleaning. Data spikes were most common at section ends.
Previous | Close | Next | Top of page