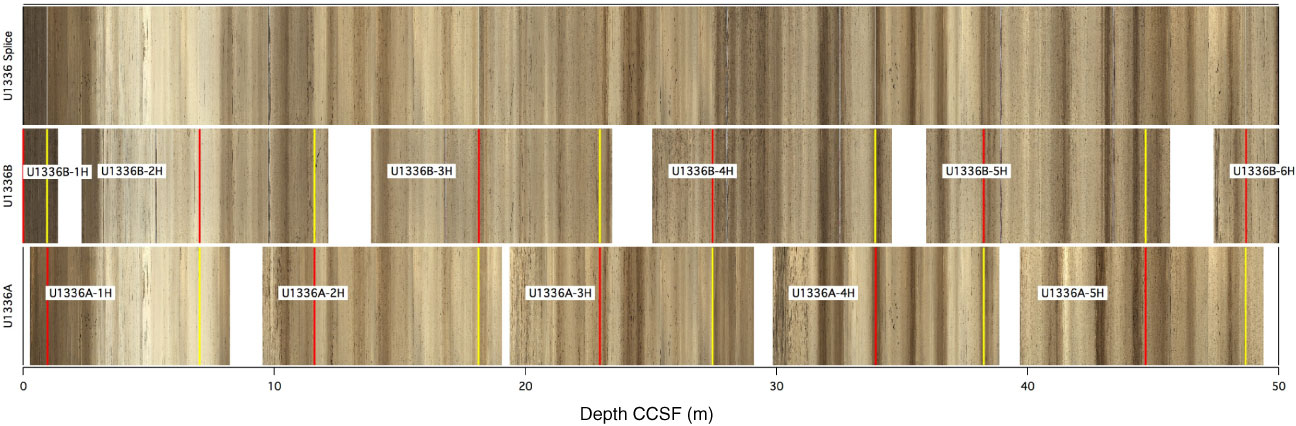
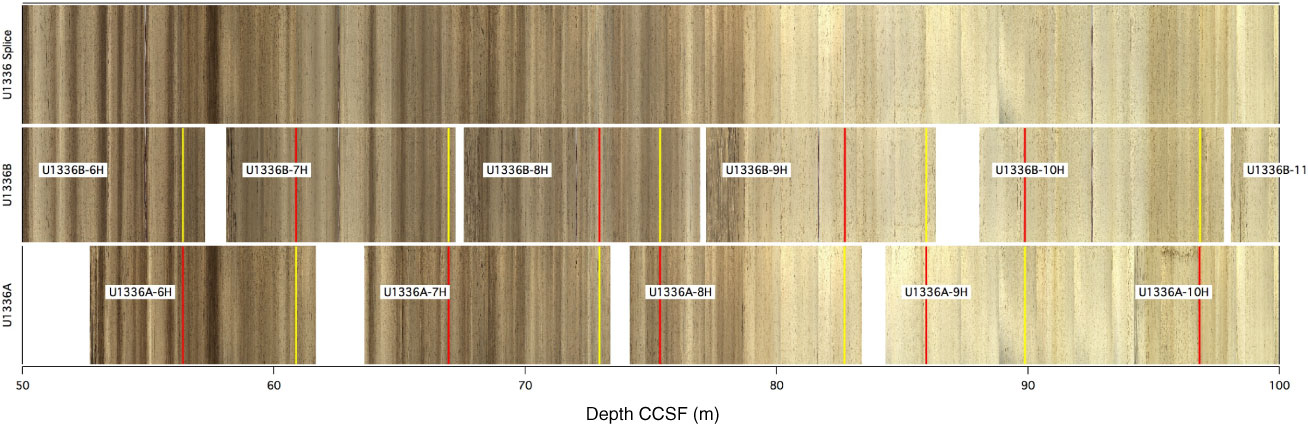
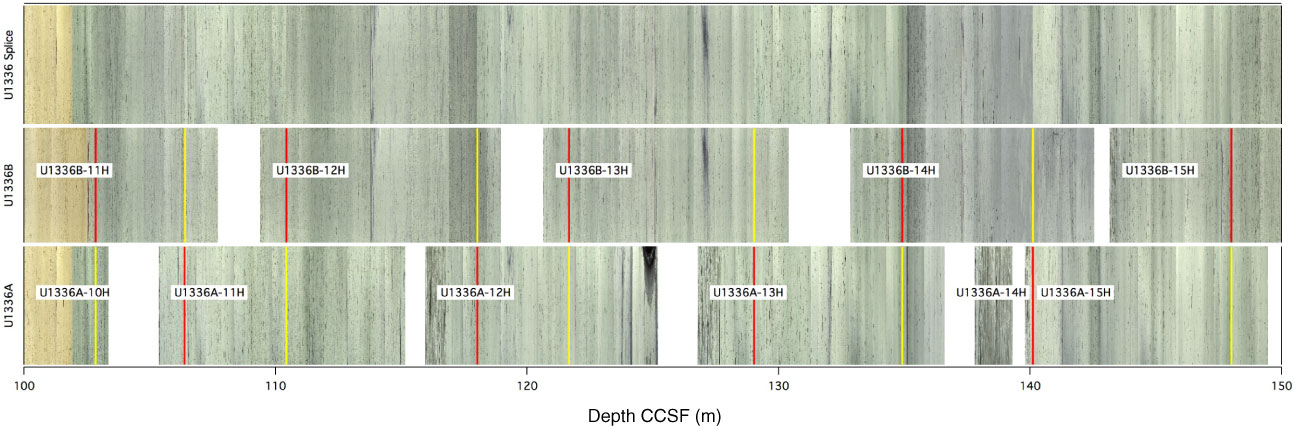
Figure F3. Spliced core images, Sites U1336–U1338. Red bars represent the top of each interval used in the splice, whereas yellow bars correspond with the bottom. Note that outside of the splice intervals within each core there is general alignment with splice features, but it is not always exact. (Continued on next page.)
Previous | Close | Next | Top of page