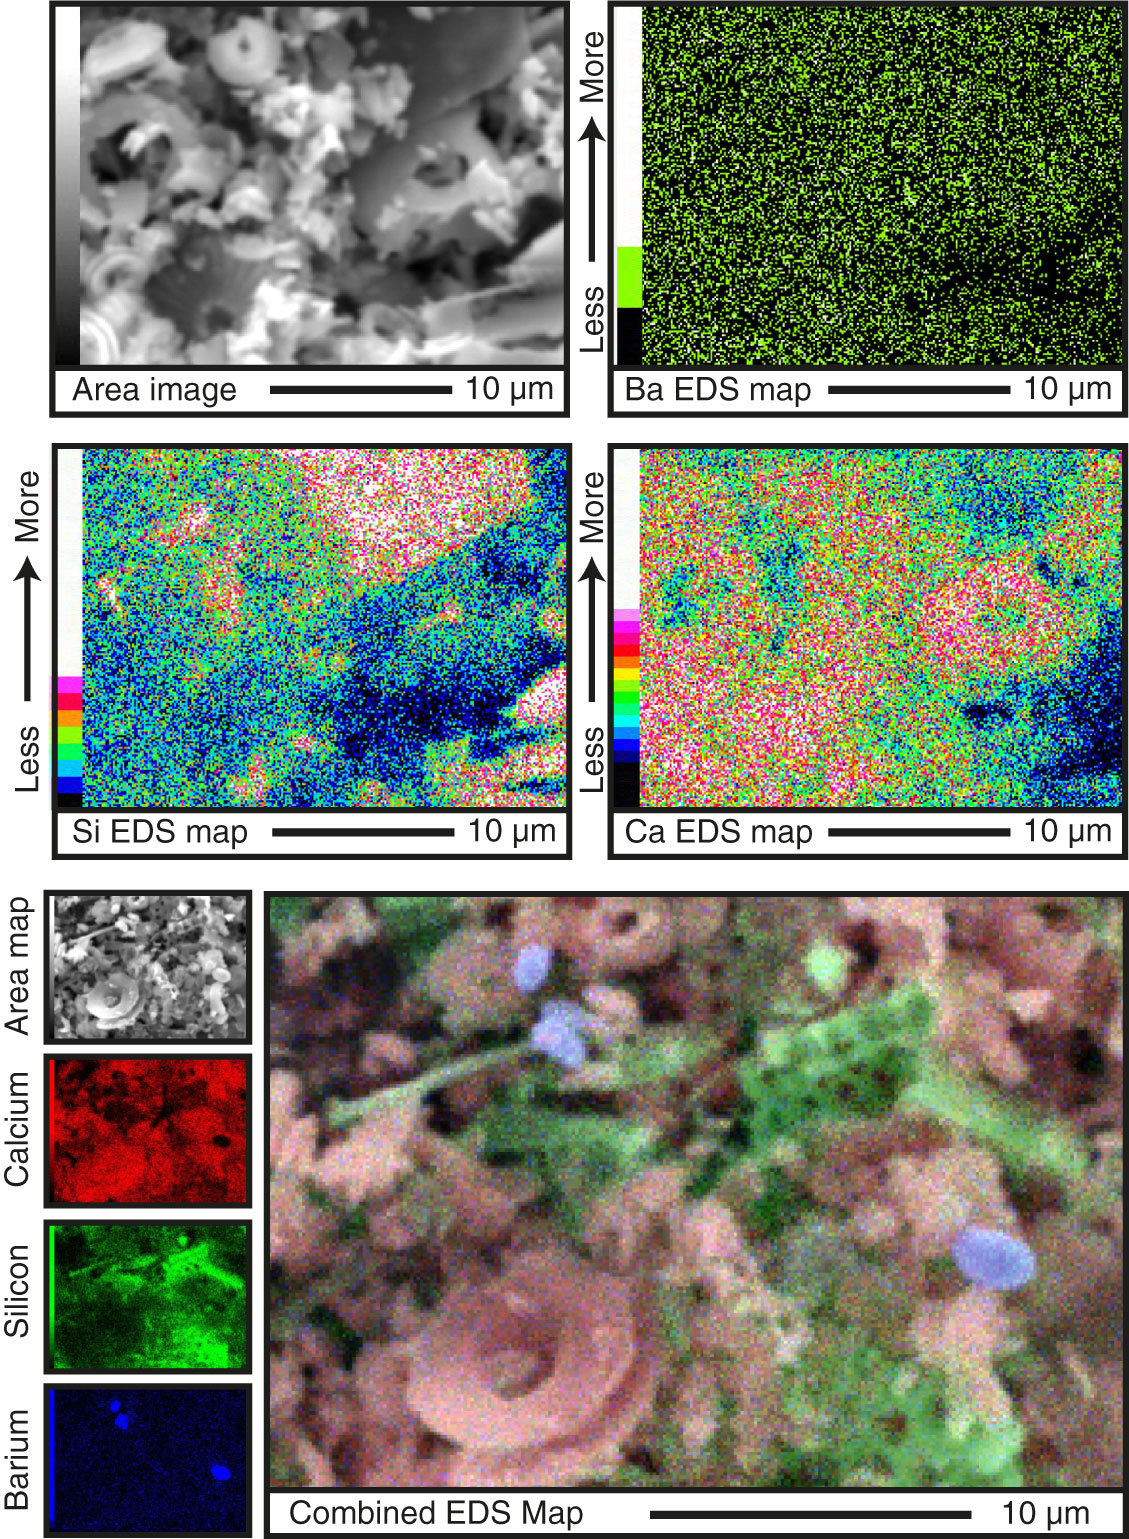
Figure F6. Overview of representative areas that were elementally mapped using energy dispersive spectroscopy (EDS) on Sample c2. In the upper section, the individual area image and barium, calcium, and silicon EDS maps are shown. For a different area, an overlay of Ba, Ca, and Si over the image is shown below. These EDS maps show that the main two components are biogenic SiO2 (green areas) and CaCO3 (red areas), although there is also some marine barite present (blue areas) in this area.
Previous | Close | Top of page