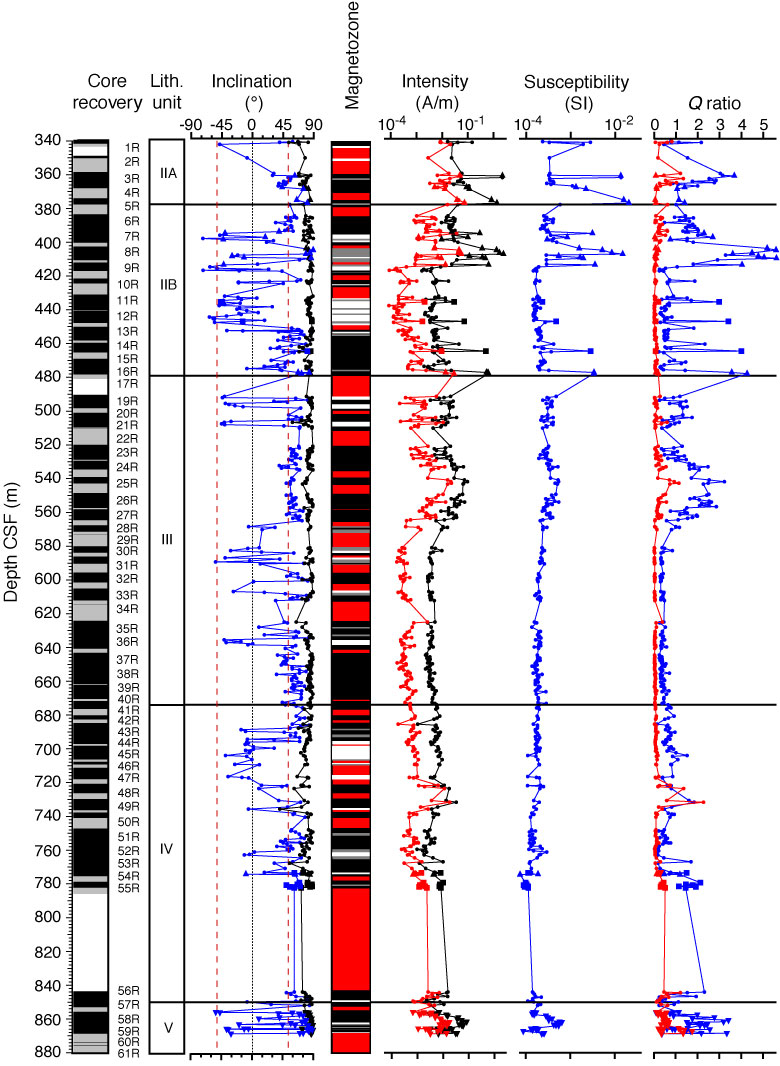
Figure F36. Results of paleomagnetic measurements on discrete samples plotted versus depth, Hole C0011B. From left to right: inclination (black = NRM before demagnetization, blue = linear regression fitting), magnetozones identified (black = normal polarity, white = reversed polarity, gray = undetermined, red = no core recovery or no data), magnetization intensity (black = NRM before demagnetization, red = after AF demagnetization at 10 mT), magnetic susceptibility, Q ratio (Königsberger ratio; blue = NRM0 mT – NRM10 mT, red = NRM10 mT; see text for details) are shown. Circles = claystone or siltstone, triangles = tuffaceous/volcaniclastic sandstone, rectangles = silty sandstone/sandstone, inverted triangles = tuff/tuffaceous siltstone.
Previous | Close | Next | Top of page