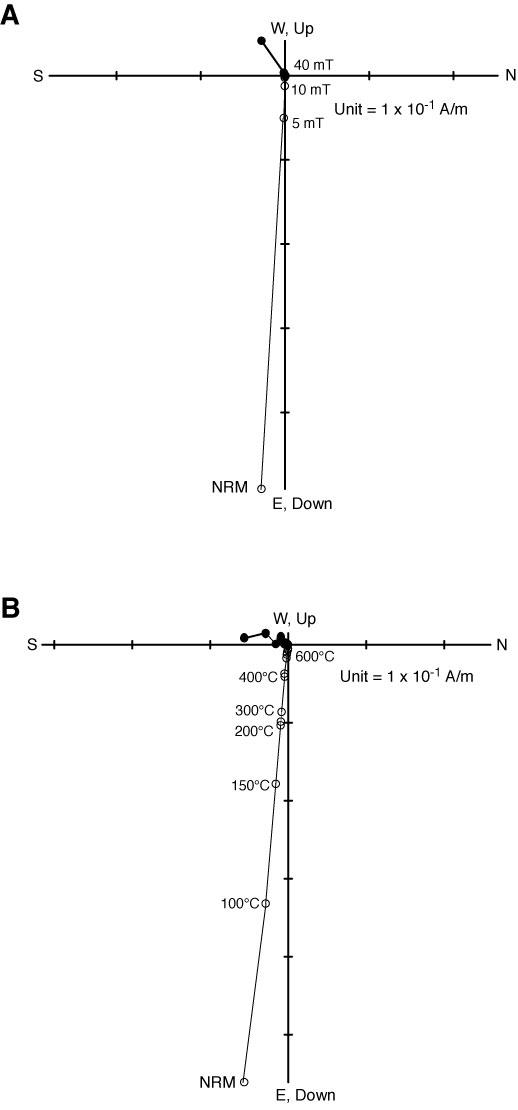
Figure F40. Vector endpoint diagrams of magnetization directions for samples showing persistent DIRM through (A) stepwise AF demagnetization (Sample 322-C0011B-16R-1, 35–37 cm) and (B) thermal demagnetization (Sample 322-C0011B-16R-1, 38–40 cm). Open and solid circles = projection of magnetization vector endpoints onto vertical and horizontal planes, respectively.

Previous | Close | Next | Top of page