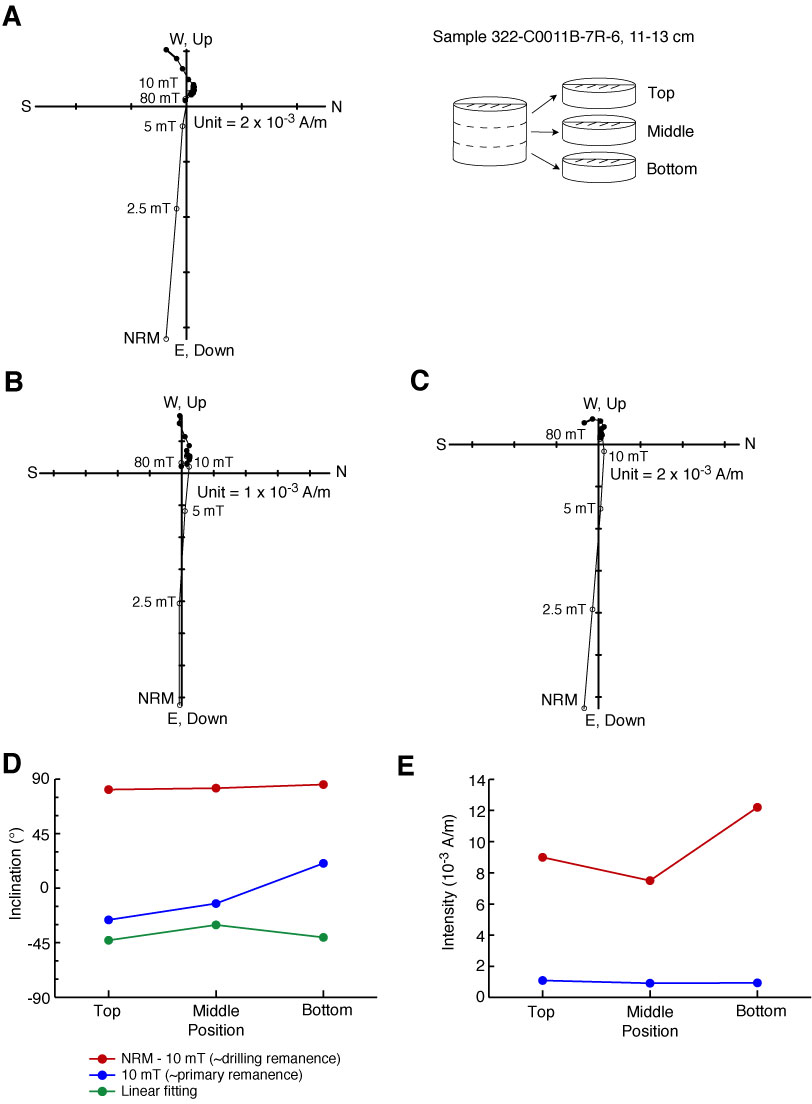
Figure F39. Demagnetization behavior, Sample 322-C0011B-7R-6, 11–13 cm (398.38 m CSF). Sample was sliced into three specimens. Vector endpoint diagrams shown for each specimen (A) top, (B) middle, and (C) bottom. Open and solid circles = projection of magnetization vector endpoints onto vertical and horizontal planes, respectively. D. Inclinations after AF demagnetization at 10 mT and inclinations of vector components after subtracting natural remanent magnetization (NRM) at 10 mT from those before demagnetization plotted with inclination by linear regression fitting. E. Magnetization intensity after AF demagnetization at 10 mT and intensity of the vector components after subtracting NRM at 10 mT from those before demagnetization.
Previous | Close | Next | Top of page