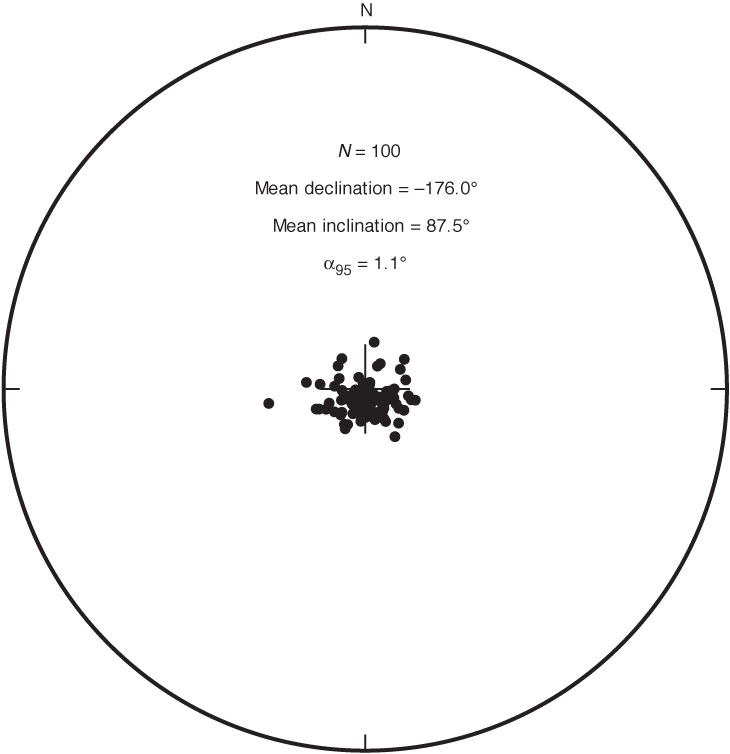
Figure F38. Directions of DIRM were estimated for samples taken from Unit II in Hole C0011B by subtracting vector components of NRM after AF demagnetization at 10 mT from NRM before demagnetization and plotted on a stereo plot. Solid circles = projected on lower hemisphere. Mean direction shows direction of very steep inclination.
Previous | Close | Next | Top of page