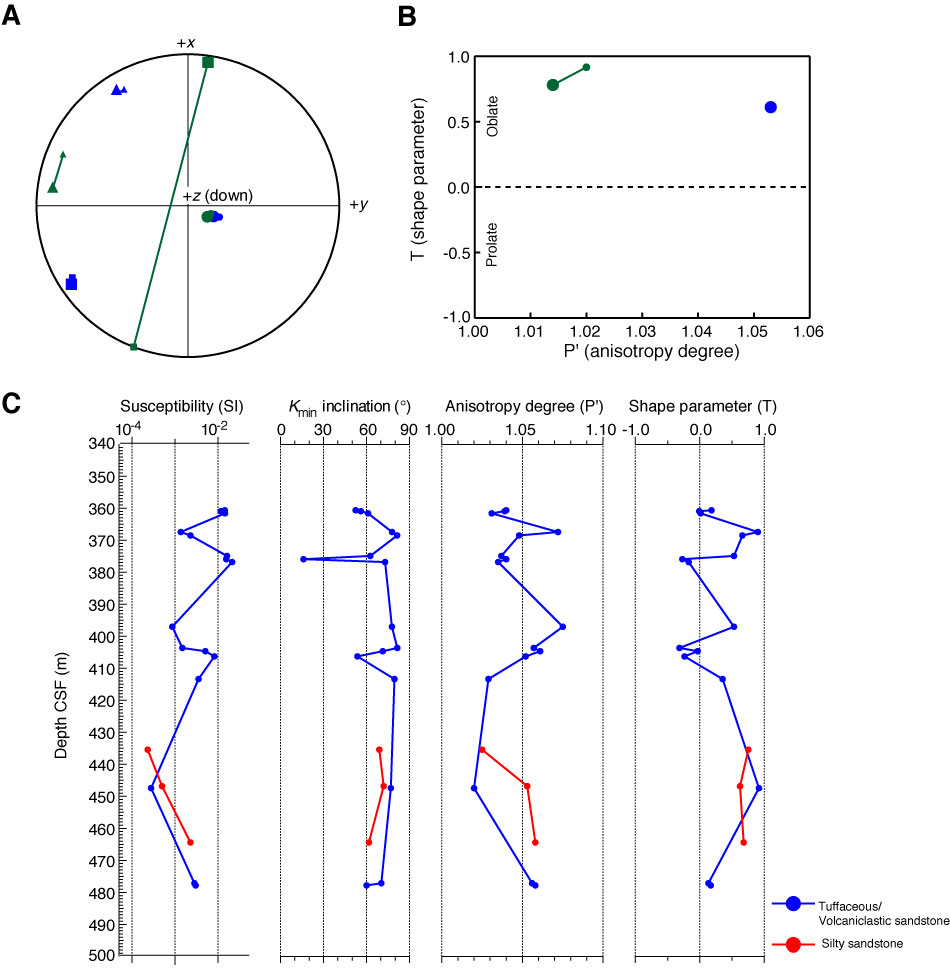
Figure F44. A. AMS principal axes projected onto lower hemisphere of equal area plot for Samples 322-C0011B-12R-5, 15–17 cm (blue; silty sandstone), and 12R-7, 9–11 cm (green; silty claystone). Rectangles = Kmax, triangles = Kint, circles = Kmin. Small symbols = directions before demagnetization, large symbols = directions after demagnetization. B. T (shape parameter) plotted versus P′ (degree of anisotropy) for Samples 322-C0011B-12R-5, 15–17 cm (blue; silty sandstone), and 12R-7, 9–11 cm (green; silty claystone). Small symbols = directions before demagnetization, large symbols = directions after demagnetization. Note change in anisotropy parameter for silty claystone, but results are almost identical for silty sandstone. C. From left to right: downhole plot of magnetic susceptibility, Kmin inclination, anisotropy degree (P′), and shape parameter (T) for tuffaceous/volcaniclastic sandstones and silty sandstones of Unit II.
Previous | Close | Next | Top of page