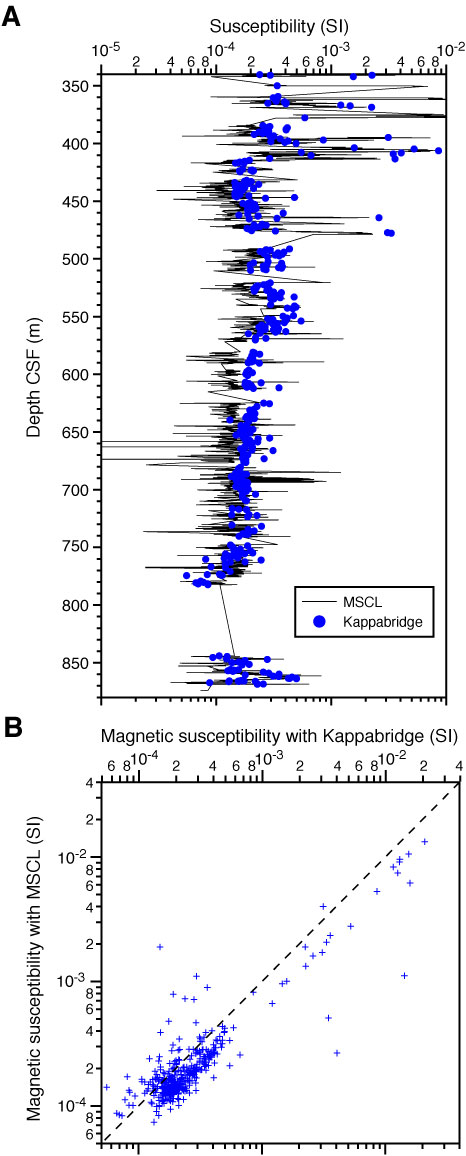
Figure F45. A. Plot of volume magnetic susceptibility versus depth measured with Kappabridge (blue circles) and multisensor core logger (MSCL) loop sensor (solid line). B. MSCL magnetic susceptibility after correction (CMS) plotted versus Kappabridge magnetic susceptibility (blue crosses) with a line of slope = 1 (broken line).
Previous | Close | Next | Top of page