Previous | Close | Next
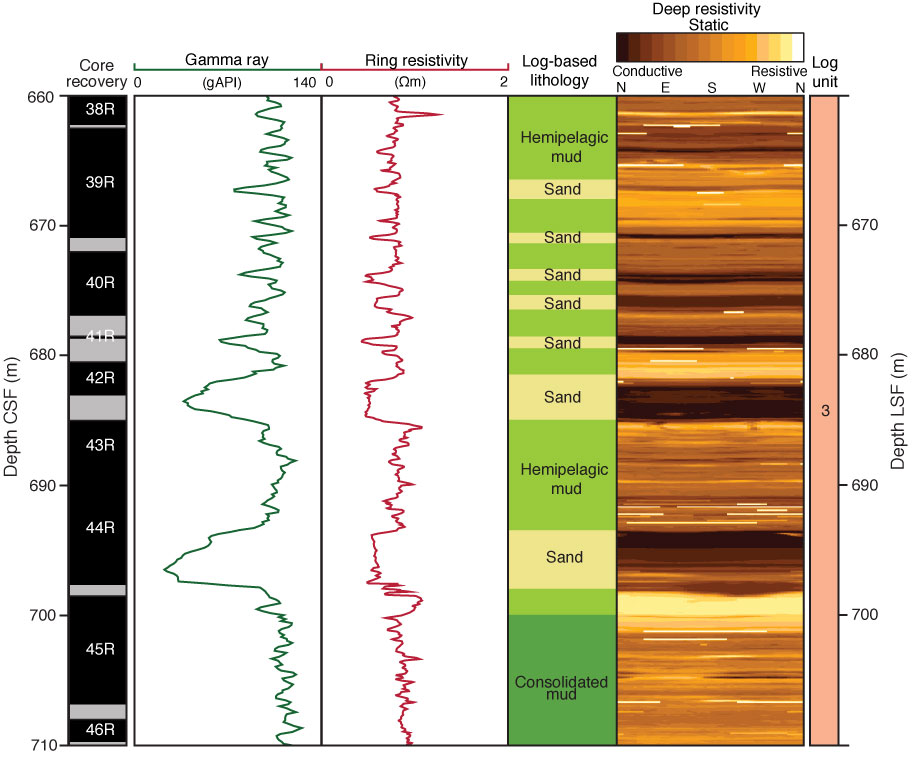
Figure F73. LWD data from an interval of logging Unit 3, highlighting low gamma ray and resistivity intervals and thickness of features interpreted as sandy layers.
Previous | Close | Next | Top of page