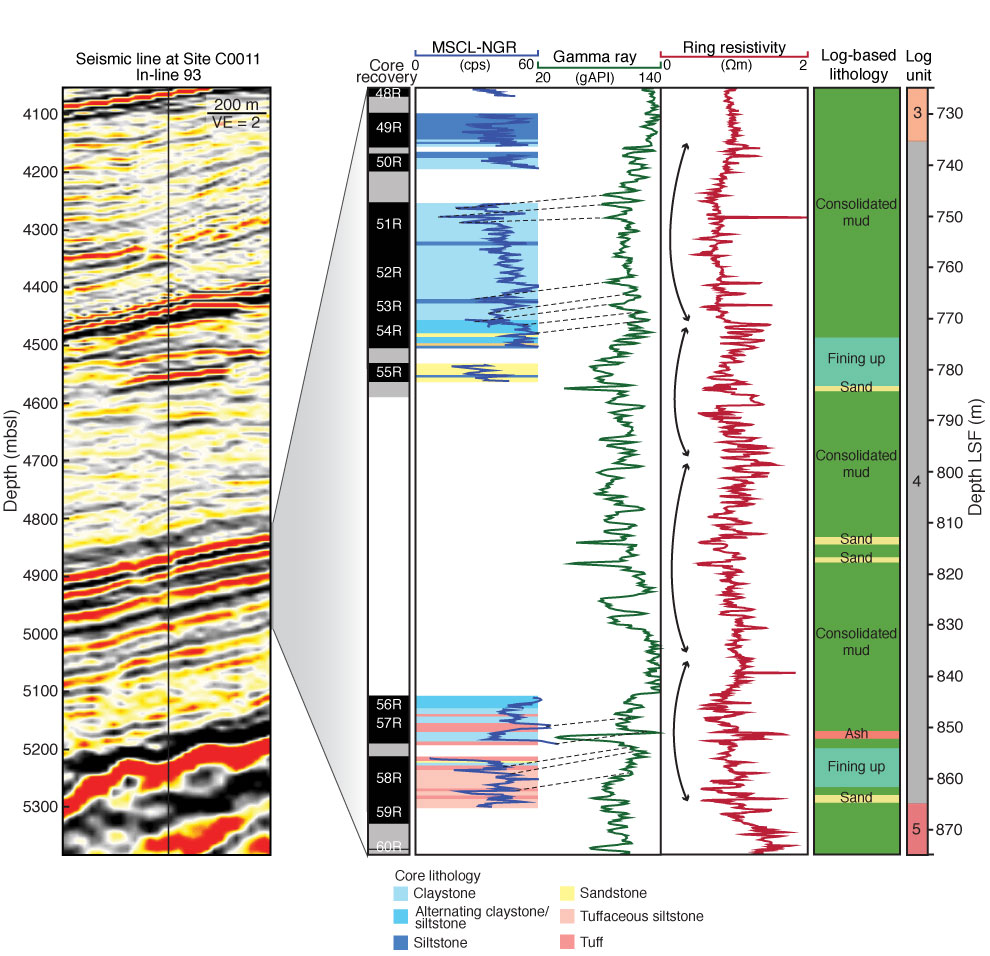
Figure F74. LWD data from logging Unit 4, showing gamma ray and resistivity logs. Left panel shows seismic data from the region. Natural gamma ray (NGR) data (blue) for correlation between logs and cores, with colored core lithology from visual core descriptions. Heavy black lines = four packages of similar log character. VE = vertical exaggeration, MSCL = multisensor core logger.
Previous | Close | Next | Top of page