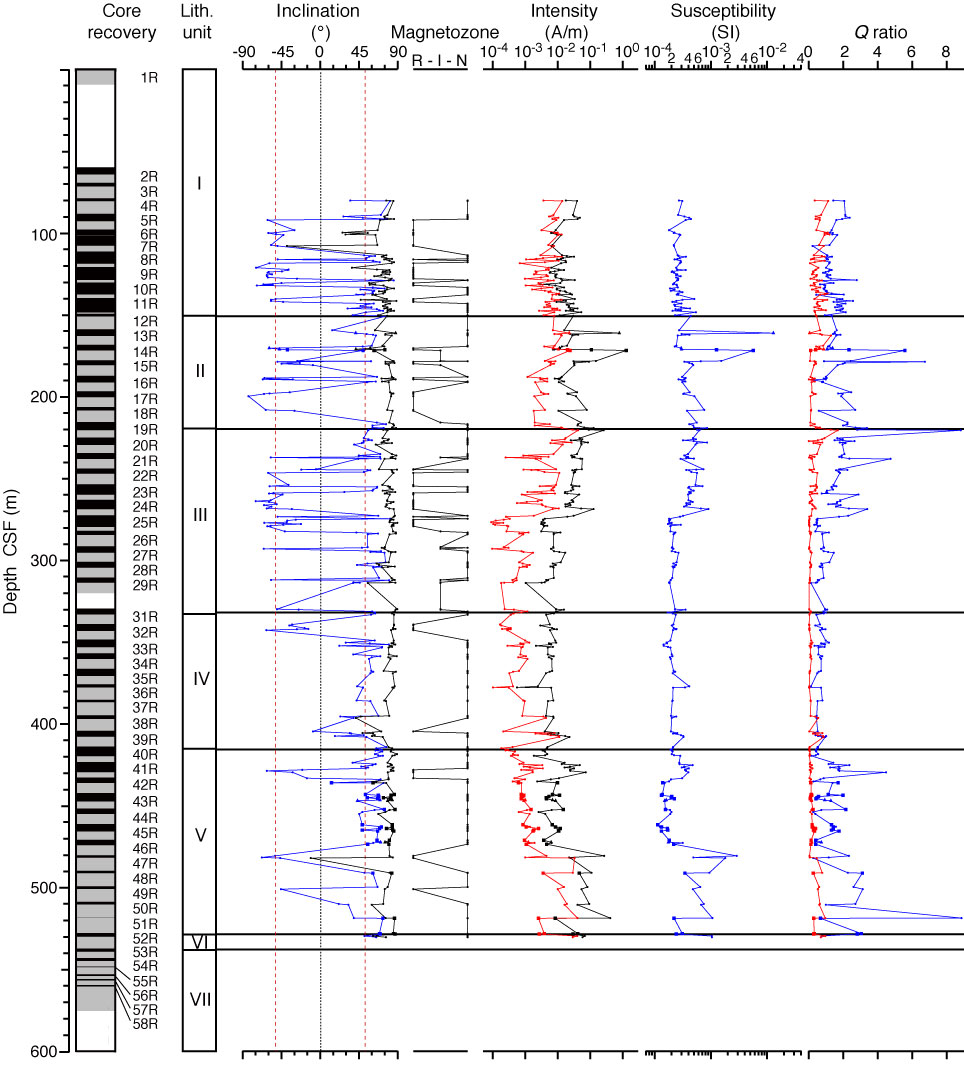
Figure F35. Results of paleomagnetic measurements on discrete samples plotted versus depth, Hole C0012A. From left to right, inclination (black = NRM before demagnetization, blue = linear regression fitting), magnetozones identified from this study (right = normal polarity, left = reversed polarity), magnetization intensity (black = NRM before demagnetization, red = after AF demagnetization at 10 mT), magnetic susceptibility, and Q ratios (blue = NRM0 mT – NRM10 mT, red = NRM10 mT; see text for details). Squares = tuffaceous sandstone, circles = volcanic sandstones.
Previous | Close | Next | Top of page