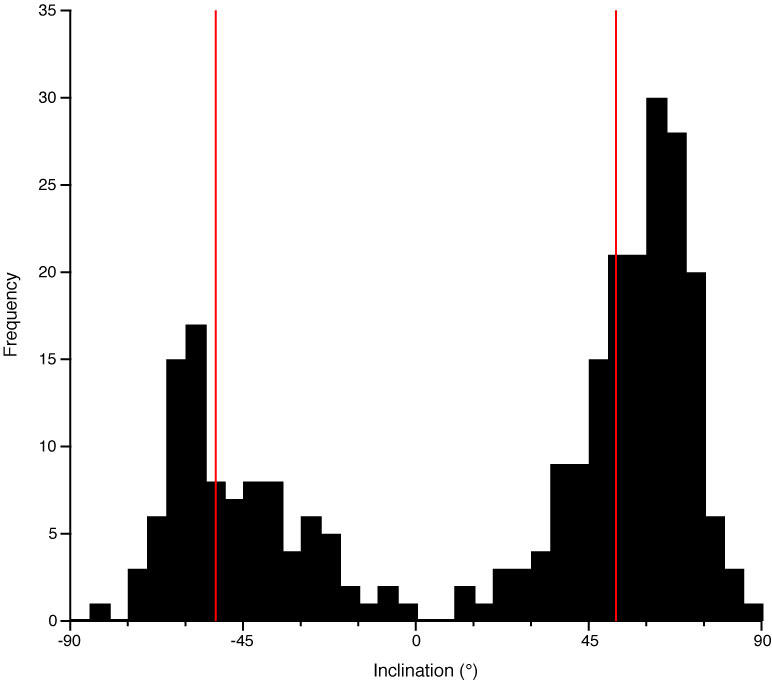
Figure F36. Histogram of inclinations isolated from the 269 discrete samples, Hole C0012A. Inclinations from these discrete samples are mostly concentrated at ±60° (positive and negative peaks). Red lines = inclination values theoretically predicted for the latitude of this site (±52.1°).
Previous | Close | Next | Top of page