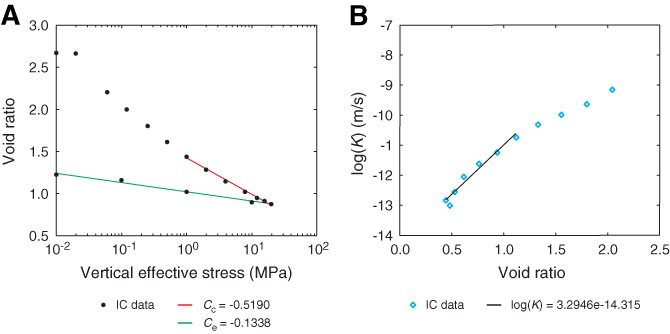
Figure F8. Plots of experimental results from Sample 322-C0011B-28R-1, 0–17 cm (lithologic Unit III; 568 m CSF; silty claystone). A. Data from incremental loading consolidation test (IC) with regression lines for primary compression (red) and elastic compression (green). B. Logarithm of hydraulic conductivity as a function of void ratio determined from incremental loading consolidation test. Note that this sample was remolded before testing.
Previous | Close | Next | Top of page