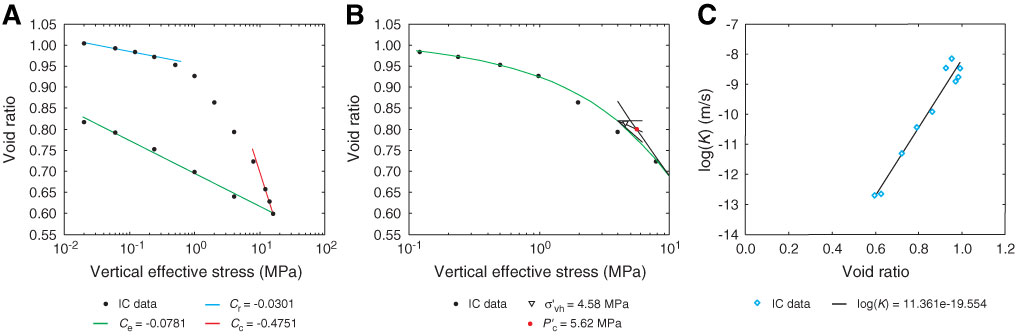
Figure F9. Plots of experimental results from Sample 322-C0011B-35R-5, 67–87 cm (lithologic Unit III; 629.57 m CSF; silty claystone). A. Data from incremental loading consolidation test (IC) conducted on intact sample with regression lines for recompression (blue), primary compression (red), and elastic compression (green). B. Maximum past effective stress P′c with Casagrande construction and in situ hydrostatic vertical effective stress σ′vh. C. Logarithm of hydraulic conductivity as a function of void ratio determined from IC.
Previous | Close | Next | Top of page