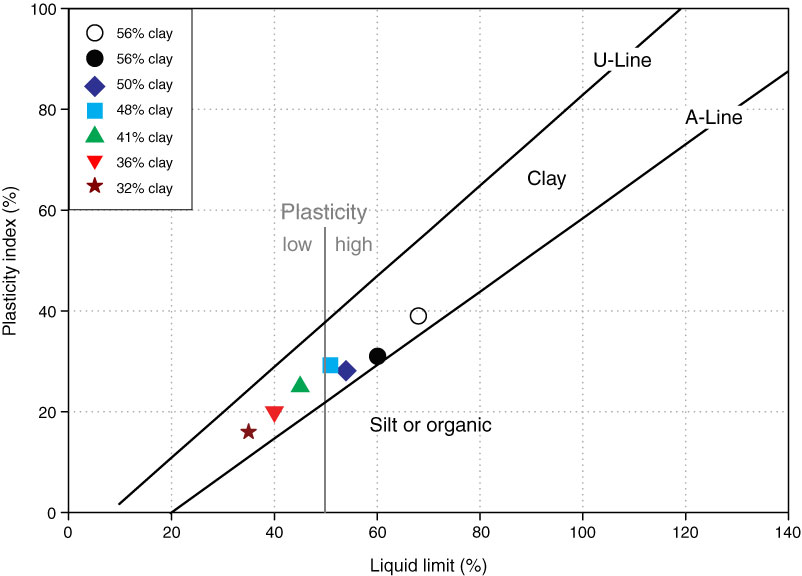
Figure F3. Plasticity chart (Table T5). Open circle = 56% clay measured on air-dried bulk material (before resedimentation), solid circle = 56% clay measured on oven-dried specimen after resedimentation/before CRS testing. Measurements of 50%, 48%, 41%, 36%, and 32% clay samples were done on oven-dried specimens after CRS testing. U-Line is an upper boundary of expected results for natural soils. A-Line separates clay from silt.
Previous | Close | Next | Top of page