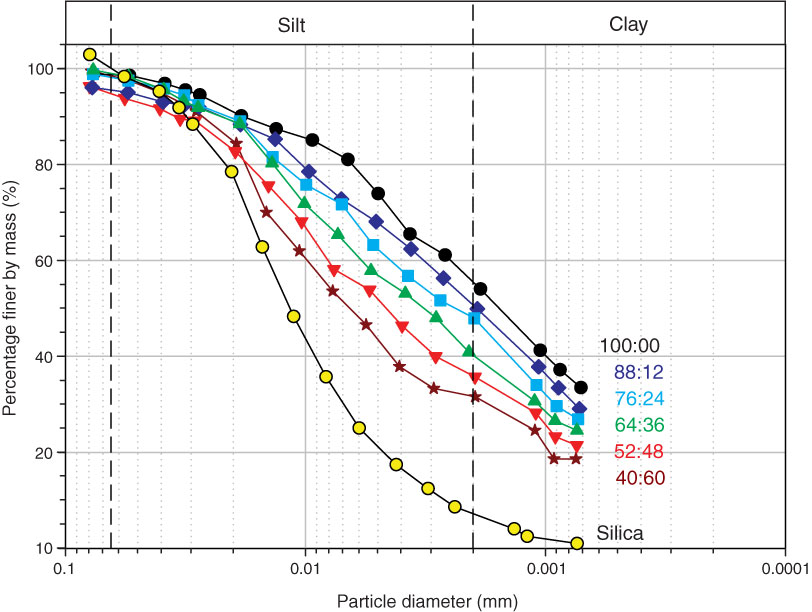
Figure F5. Particle size distribution plots on a semi-log scale (Table T6). All data points represent hydrometer readings. Sand/silt boundary is defined at 62.5 µm and silt/clay boundary is defined at 2 µm. Black circles = 56% clay, dark blue diamonds = 50% clay, light blue squares = 48% clay, green triangles = 41% clay, red triangles = 36% clay, brown stars = 32% clay, yellow circles = silt-size silica (8% clay). Particle size distribution sheets for all experiments are in PARTSIZE in “Supplementary material.”
Previous | Close | Next | Top of page