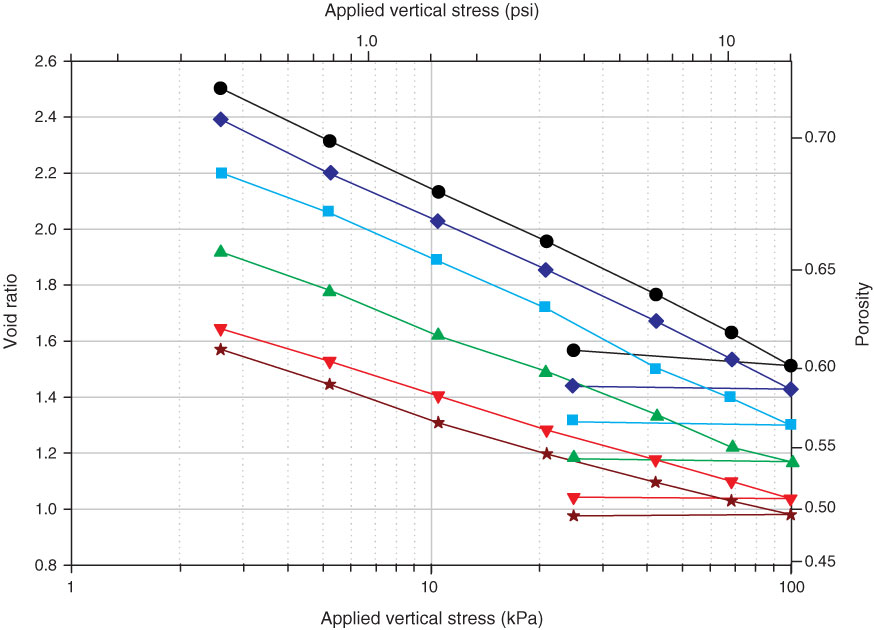
Figure F6. Compression curves during resedimentation (Table T7). Each data point represents the vertical effective stress and void ratio at the end of a stress increment. Black circles = 56% clay, dark blue diamonds = 50% clay, light blue squares = 48% clay, green triangles = 41% clay, red triangles = 36% clay, brown stars = 32% clay.
Previous | Close | Next | Top of page