Previous | Close
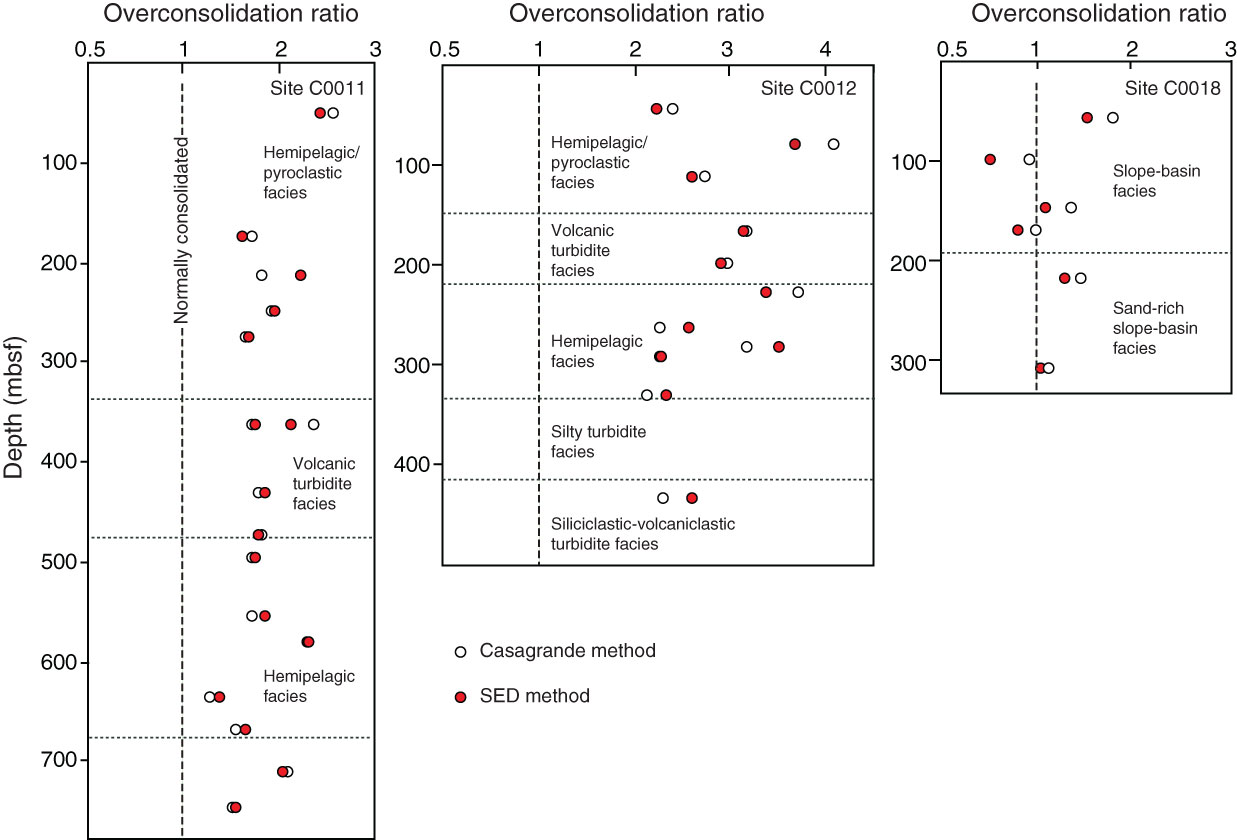
Figure F11. Values of overconsolidation ratio plotted as a function of depth, Sites C0011, C0012, and C0018.
Previous | Close | Top of page