Previous | Close | Next
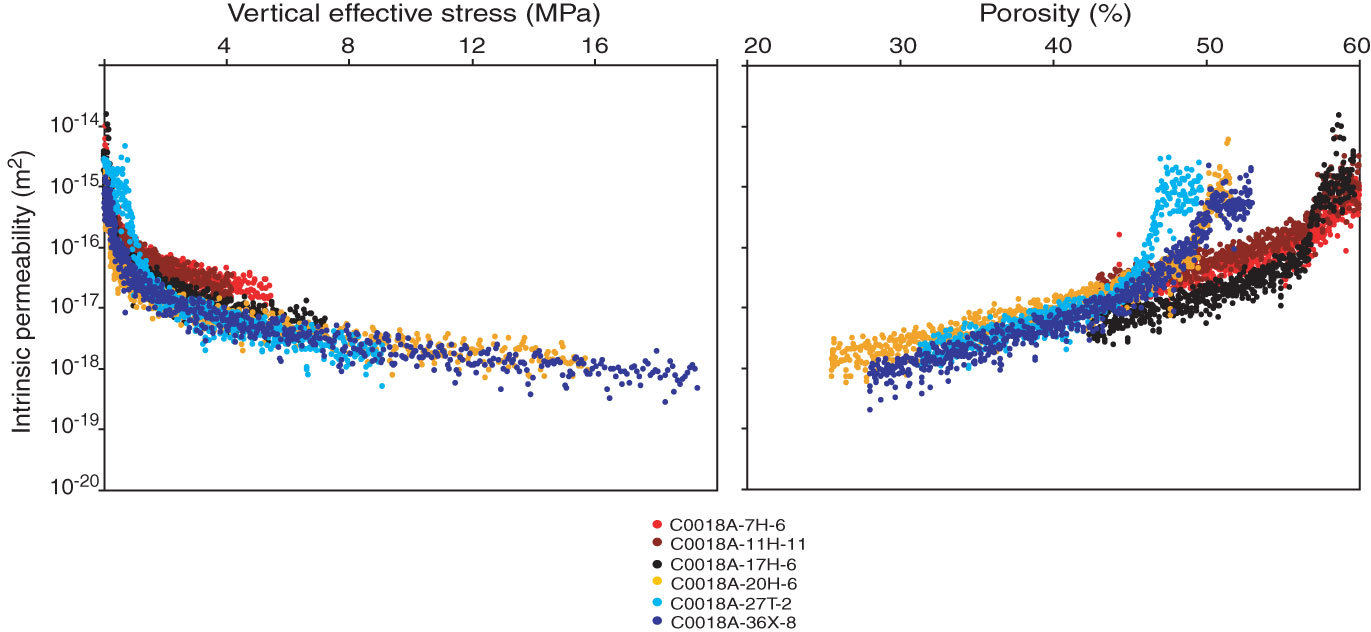
Figure F10. Intrinsic permeability under laboratory testing conditions plotted as a function of vertical effective stress and porosity, Site C0018. Data from the transient phases of the tests were not used.
Previous | Close | Next | Top of page