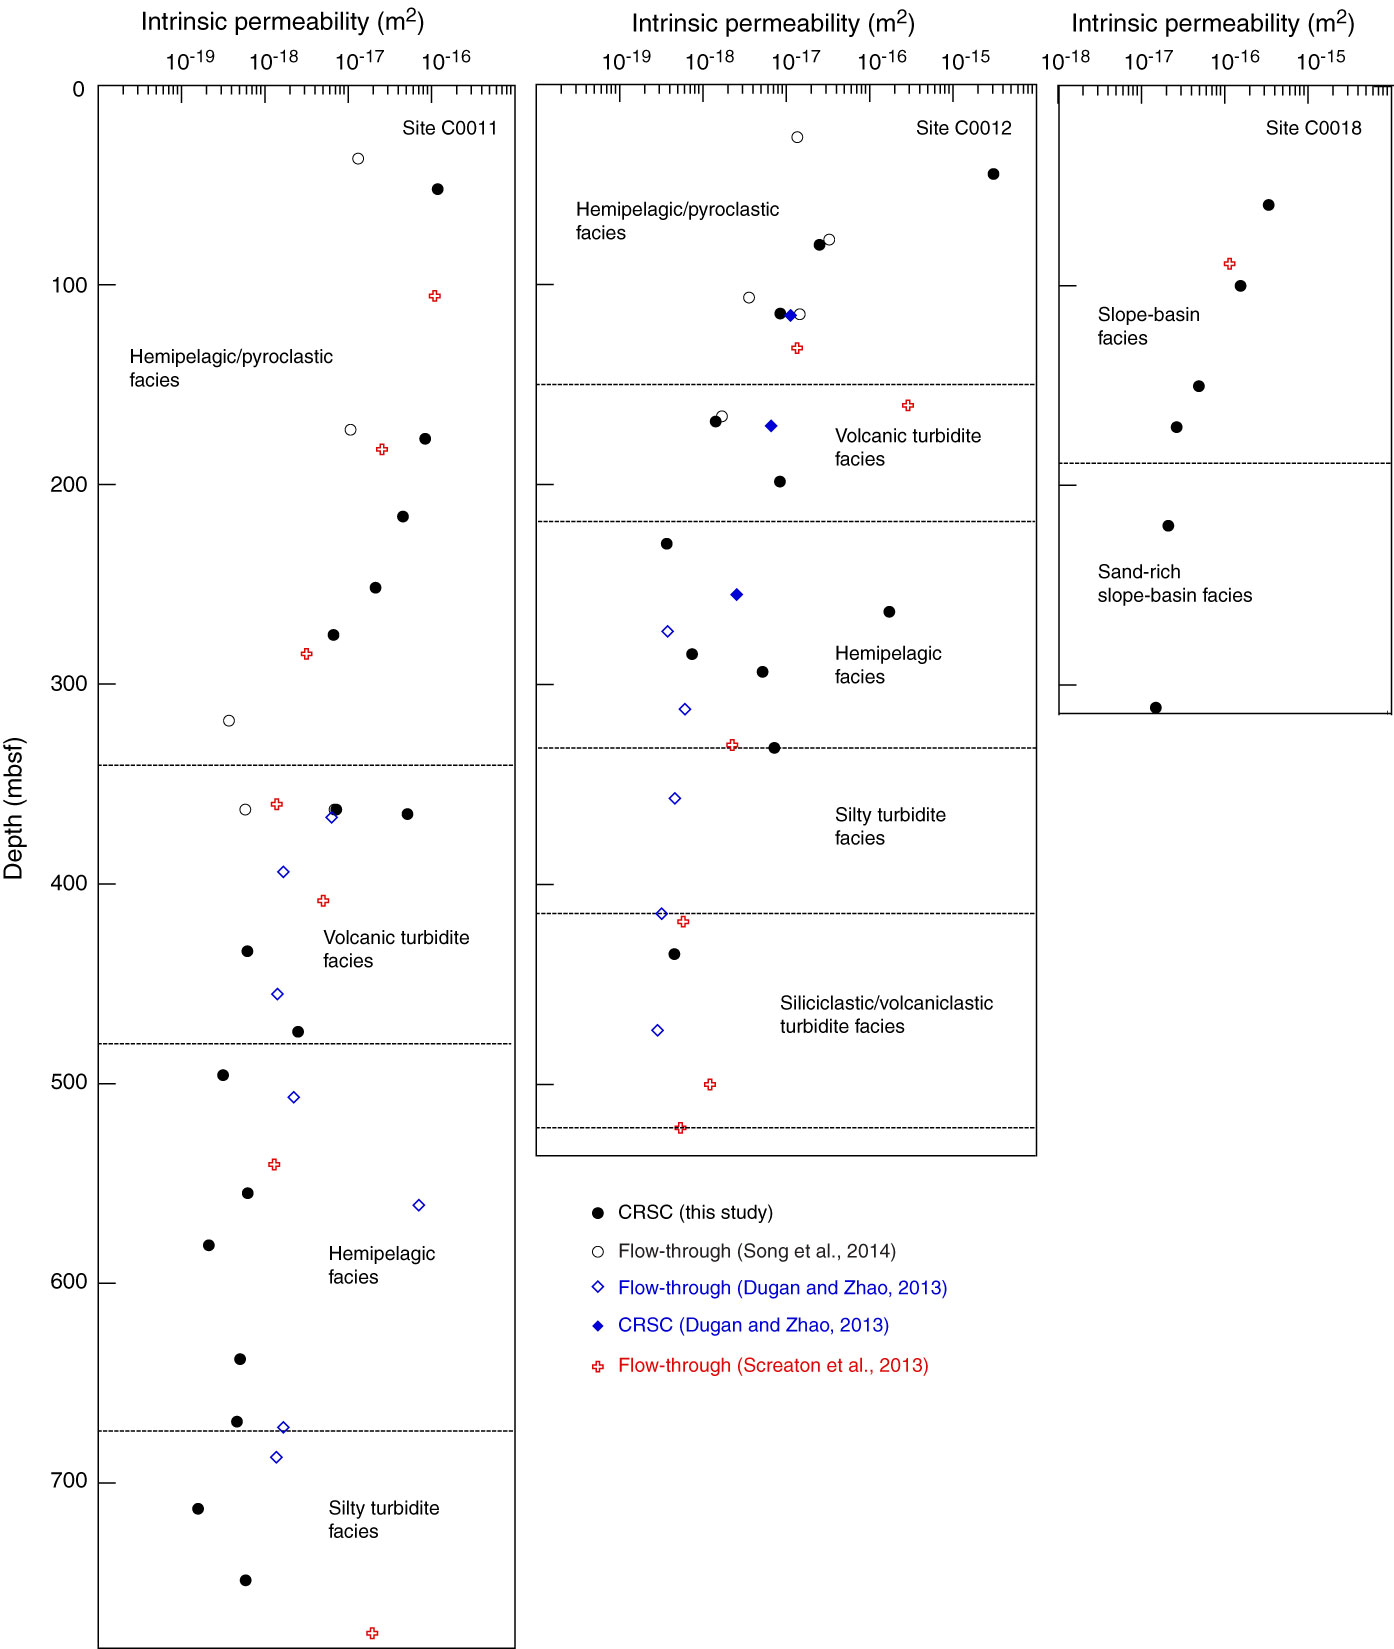
Figure F9. In situ intrinsic permeability plotted as a function of depth at Sites C0011, C0012, and C0018. Values were determined by projecting the permeability-porosity trend for each mudstone sample to the value of in situ void ratio at the intersection point of P′c. Complementary data from CRSC tests and flow-through tests (at lower confining pressures) are shown for comparison (Screaton et al., 2013; Dugan and Zhao, 2013; Song et al., in press).
Previous | Close | Next | Top of page