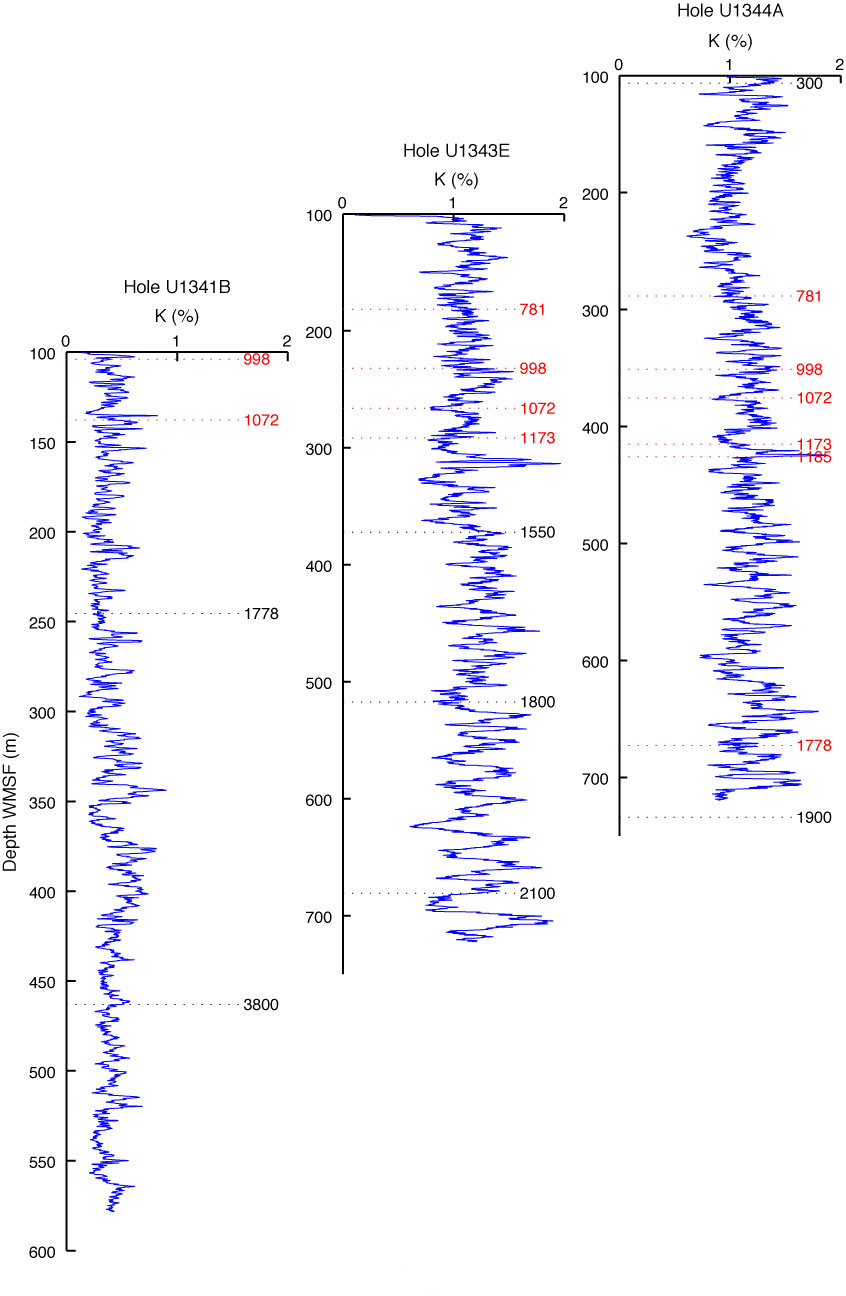
Figure F24. Variations in potassium content measured by downhole logging in Holes U1341B, U1343E, and U1344A, illustrating changes in frequency and amplitude. Biostratigraphic (black) and paleomagnetic (red) age estimates are also shown.

Previous | Close | Next | Top of page