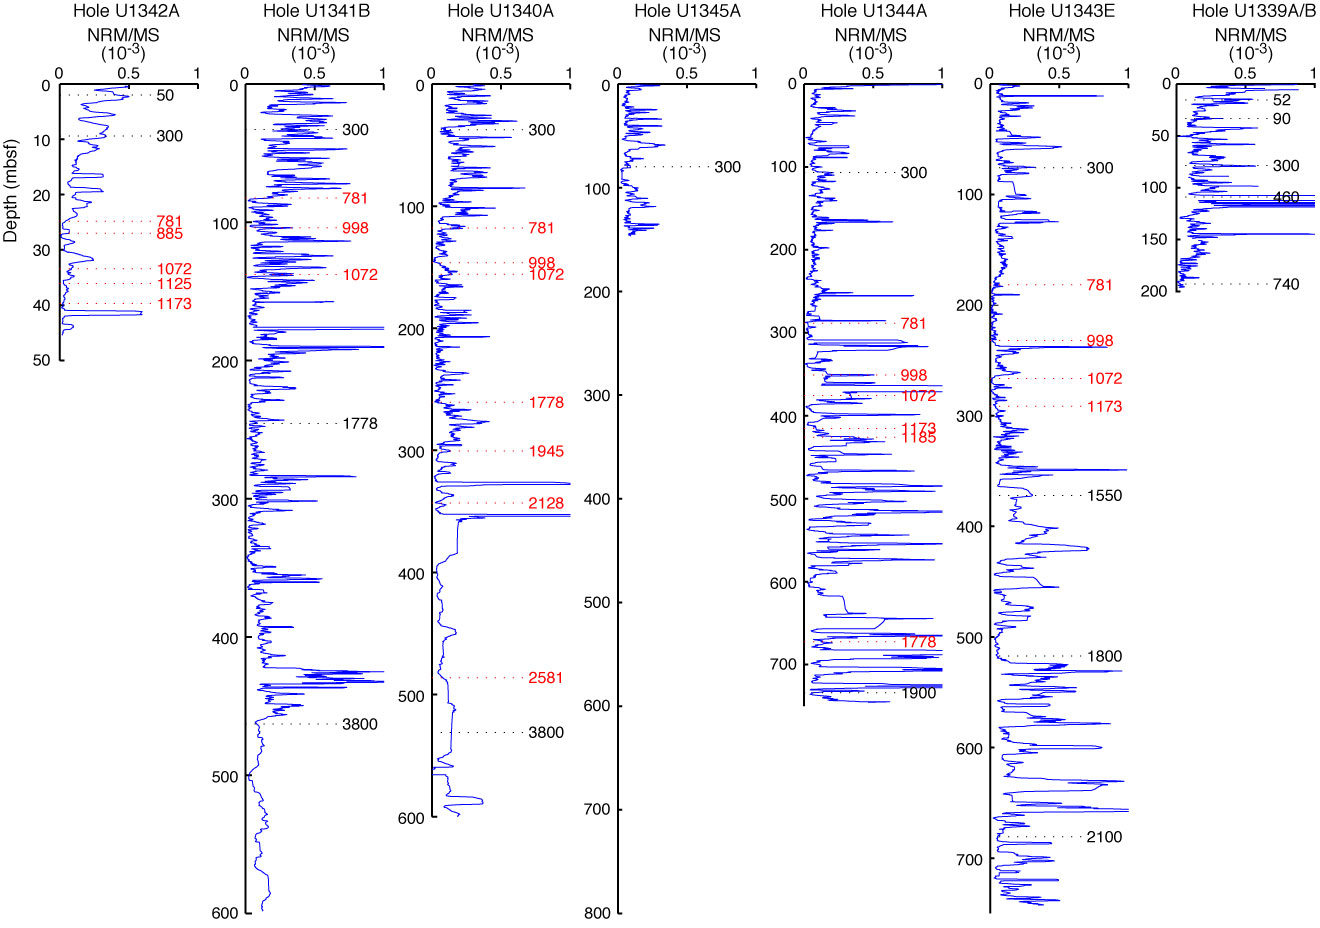
Figure F25. Variations in the ratio of natural remanent magnetization (NRM) to magnetic susceptibility (MS), or relative paleointensity, along with biostratigraphic (black) and paleomagnetic (red) age estimates in k.y. for the seven drill sites (see Tables T3, T4, T5, T6, T7, T8, T9).

Previous | Close | Next | Top of page