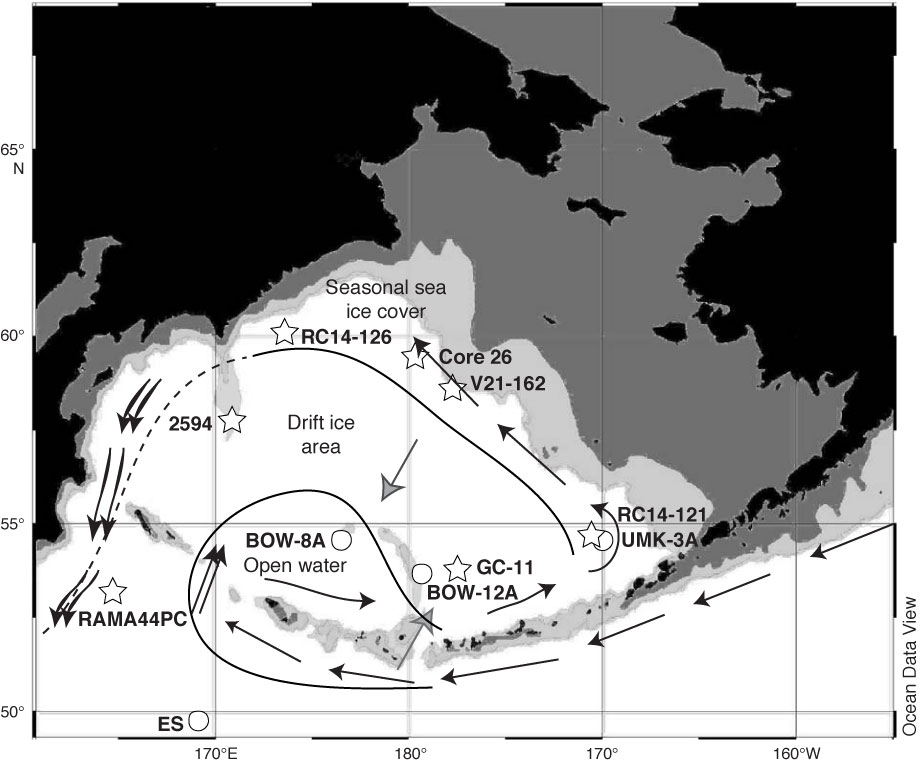
Figure F4. Example of reconstructed past surface water conditions and sea ice extent during the Last Glacial Maximum in the Bering Sea (Katsuki and Takahashi, 2005). Dark gray area = paleocontinental shelf, light gray area = paleobathymetry between 400 and 900 m isobaths. Double black arrows = stronger flow than today, gray arrows = weaker flow than today. Circles = cores examined by Katsuki and Takahashi (2005), stars = cores reported from various sources as cited in Katsuki and Takahashi (2005). ES = Emperor Seamount.
Previous | Close | Next | Top of page