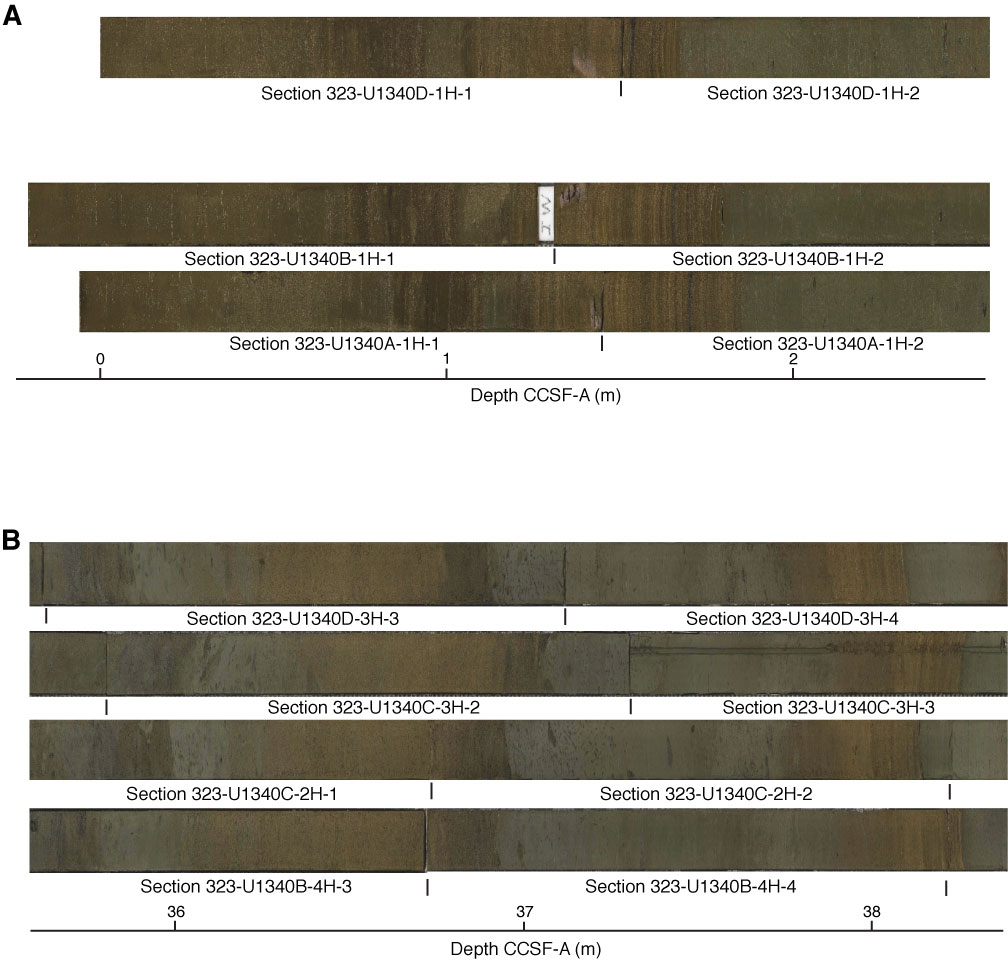
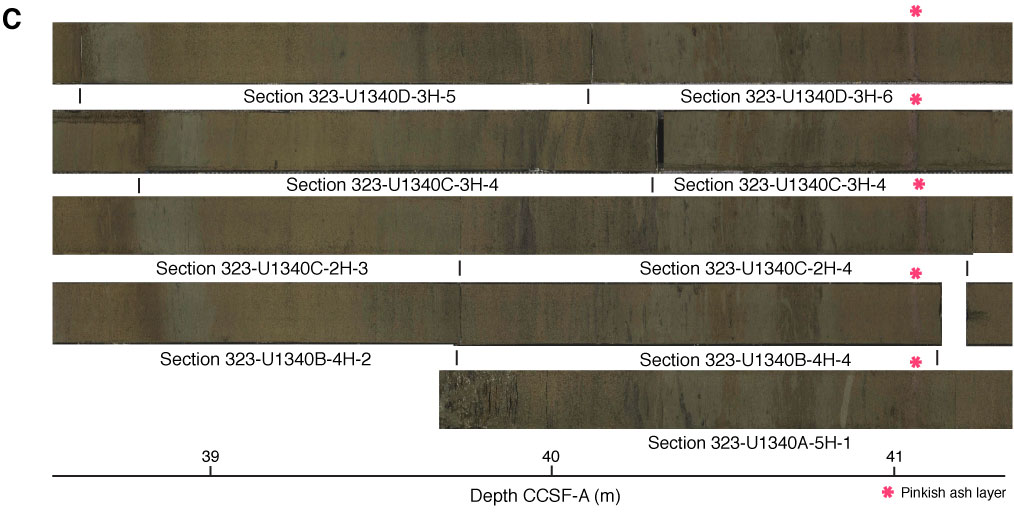
Figure F38. Digital line-scan images vs. composite depth, Site U1340. Note the pinkish ash marker beds in C in Sections 323-U1340A-5H-1, 323-U1340B-4H-3, 323-U1340C-2H-4 and 3H-4, and 323-U1340D-3H-6. Correlated features are visible throughout these cores. Offsets of a few centimeters are expected based on normal variations in sediment accumulation or minor drilling disturbance. A. 0–2 m CCSF-A. B. 36–38 m CCSF-A. C. 39–41 m CCSF-A.
Previous | Close | Next | Top of page