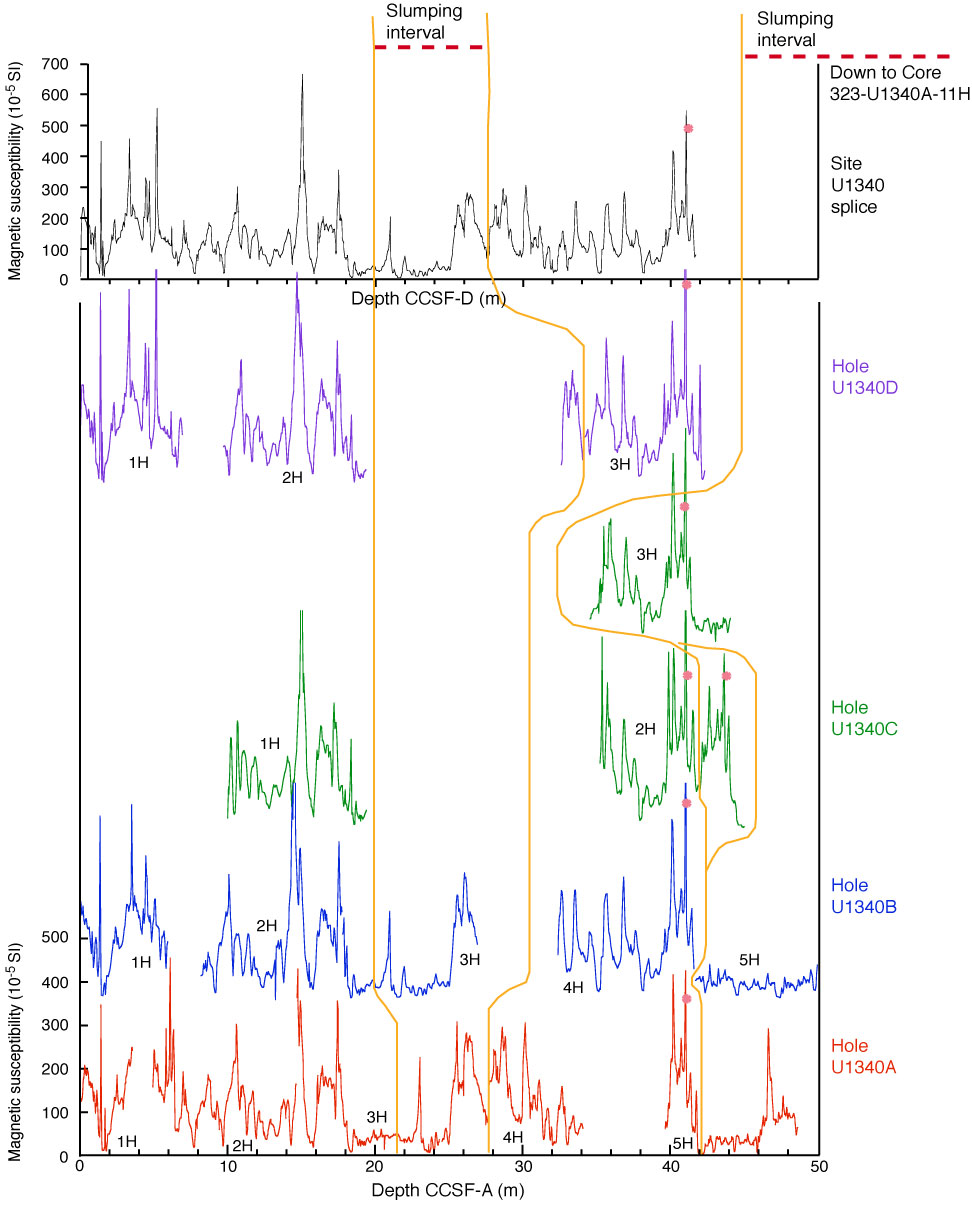
Figure F39. Spliced magnetic susceptibility, Site U1340, annotated to denote inferred intervals of soft-sediment deformation. Pink dots = locations of pinkish ash layers shown in Figure F38C. For the splice record (top panel), depth on the CCSF-D scale is equivalent to depth on the CCSF-A scale.
Previous | Close | Next | Top of page