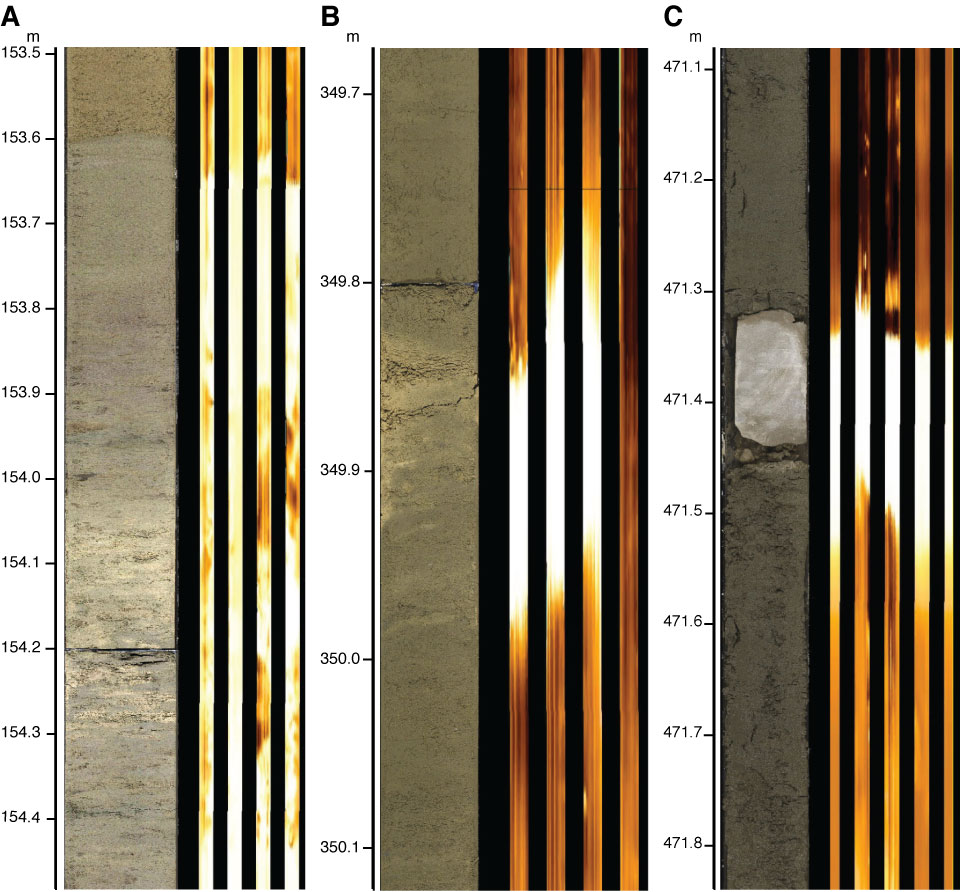
Figure F39. Correlation between Formation MicroScanner (FMS) electrical images and core observations. (A, B) Authigenic carbonates and (C) dolostone generate higher resistivity, which is apparent as brighter color in the FMS images. The depths of the FMS images have been adjusted by up to 50 cm to illustrate the correlations. The contrast in the core images has been increased to enhance the carbonates.

Previous | Close | Next | Top of page